The histogram shown in the figure below describes the relationship between averoge velocities (in cm/s) and time (in sec.). The clistance traveled in the time interval (0.4-0.6 sec) is V(cm/) 140 60 40 0.0 0.2 1.0 0.4 0.6 0.4 O a 30 cm Ob. 40 em 1c 28 cm Od none of the above O@ 24 cm
The histogram shown in the figure below describes the relationship between averoge velocities (in cm/s) and time (in sec.). The clistance traveled in the time interval (0.4-0.6 sec) is V(cm/) 140 60 40 0.0 0.2 1.0 0.4 0.6 0.4 O a 30 cm Ob. 40 em 1c 28 cm Od none of the above O@ 24 cm

Chapter13: Electromagnetic Induction
Section: Chapter Questions
Problem 41P: In the circuit sho in the accompanying figure, the rtd slides along the conducting rails at a...

Related questions
Question
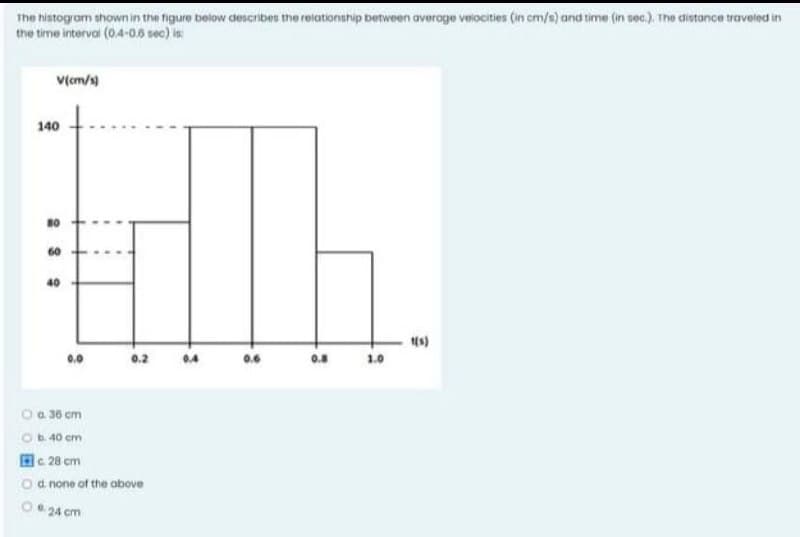
Transcribed Image Text:The histogram shown in the figure below describes the relationship between averoge velocities (in cm/s) and time (in sec.). The cistance traveled in
the time interval (0.4-0.6 sec) is
V(cm/)
140
60
40
0.0
0.2
0.4
0.6
0.4
1.0
O a 30 cm
Ob. 40 cm
1c 28 cm
Od none of the above
O@ 24 cm
Expert Solution
This question has been solved!
Explore an expertly crafted, step-by-step solution for a thorough understanding of key concepts.

Step by step
Solved in 2 steps

Knowledge Booster


Learn more about
Need a deep-dive on the concept behind this application? Look no further. Learn more about this topic, physics and related others by exploring similar questions and additional content below.Recommended textbooks for you

Classical Dynamics of Particles and Systems
Physics
ISBN:
9780534408961
Author:
Stephen T. Thornton, Jerry B. Marion
Publisher:
Cengage Learning

College Physics
Physics
ISBN:
9781938168000
Author:
Paul Peter Urone, Roger Hinrichs
Publisher:
OpenStax College
Classical Dynamics of Particles and Systems
Physics
ISBN:
9780534408961
Author:
Stephen T. Thornton, Jerry B. Marion
Publisher:
Cengage Learning
College Physics
Physics
ISBN:
9781938168000
Author:
Paul Peter Urone, Roger Hinrichs
Publisher:
OpenStax College

Glencoe Physics: Principles and Problems, Student…
Physics
ISBN:
9780078807213
Author:
Paul W. Zitzewitz
Publisher:
Glencoe/McGraw-Hill

Physics for Scientists and Engineers: Foundations…
Physics
ISBN:
9781133939146
Author:
Katz, Debora M.
Publisher:
Cengage Learning
