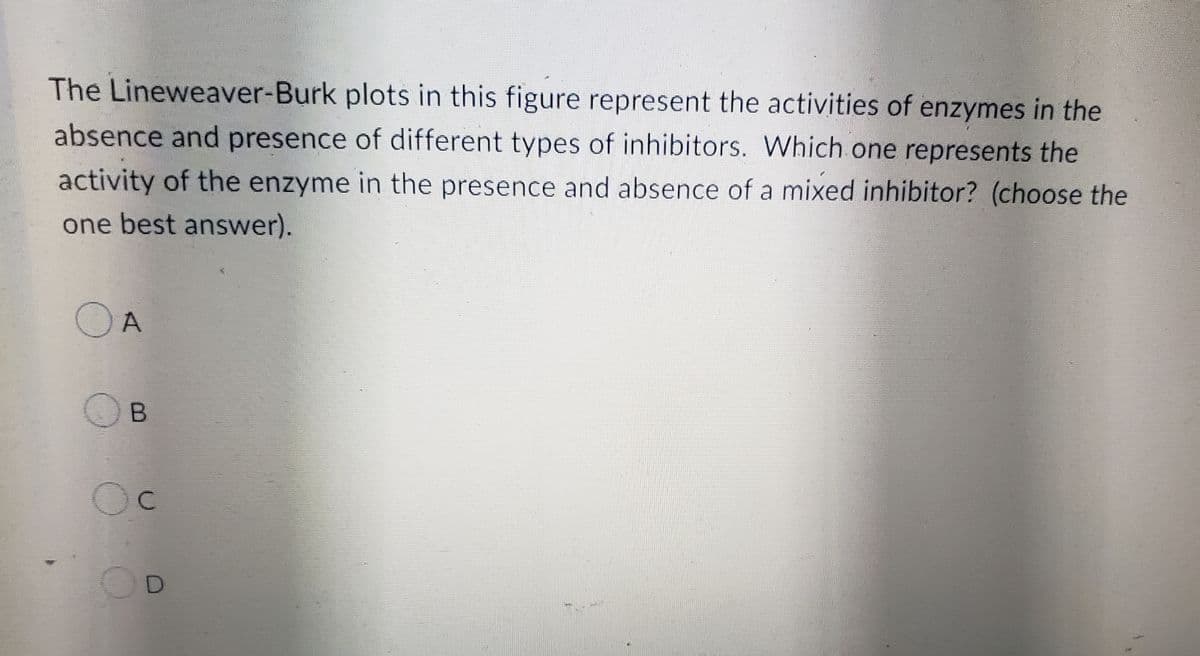
The Lineweaver-Burk plots in this figure represent the activities of enzymes in the absence and presence of different types of inhibitors. Which one represents the activity of the enzyme in the presence and absence of a mixed inhibitor? (choose the one best answer).
The Lineweaver-Burk plots in this figure represent the activities of enzymes in the absence and presence of different types of inhibitors. Which one represents the activity of the enzyme in the presence and absence of a mixed inhibitor? (choose the one best answer).

Chapter8: Introduction To Cpt Coding
Section: Chapter Questions
Problem 5MC

Related questions
Question
Transcribed Image Text:The Lineweaver-Burk plots in this figure represent the activities of enzymes in the
absence and presence of different types of inhibitors. Which one represents the
activity of the enzyme in the presence and absence of a mixed inhibitor? (choose the
one best answer).
OA
OB
Oc
D
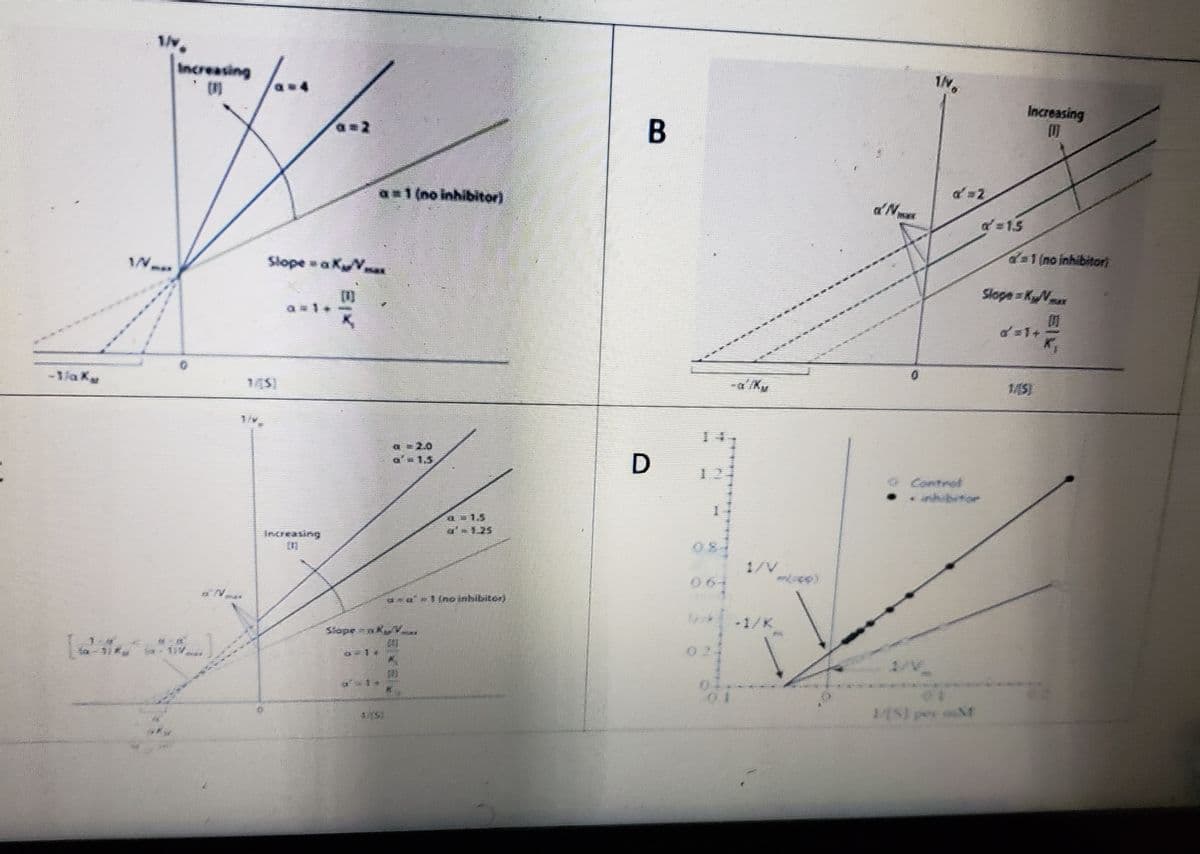
Transcribed Image Text:-1/aka
1/v.
Increasing
a=1 (no inhibitor)
Slope = a KµV…...
Slope ak
7-15
satino inhibitori
B
D
MELIN
H
W
MIN
061
d'Nat
1/V
a = 2
a=1.5
Increasing
(1)
o1 (no inhibitor)
Slope = KNALLE
Expert Solution
This question has been solved!
Explore an expertly crafted, step-by-step solution for a thorough understanding of key concepts.

This is a popular solution!

Trending now
This is a popular solution!

Step by step
Solved in 3 steps with 1 images

Recommended textbooks for you

Biochemistry
Biochemistry
ISBN:
9781305577206
Author:
Reginald H. Garrett, Charles M. Grisham
Publisher:
Cengage Learning
Essentials of Pharmacology for Health Professions
Nursing
ISBN:
9781305441620
Author:
WOODROW
Publisher:
Cengage
Biochemistry
Biochemistry
ISBN:
9781305577206
Author:
Reginald H. Garrett, Charles M. Grisham
Publisher:
Cengage Learning
Essentials of Pharmacology for Health Professions
Nursing
ISBN:
9781305441620
Author:
WOODROW
Publisher:
Cengage
Understanding Health Insurance: A Guide to Billin…
Health & Nutrition
ISBN:
9781337679480
Author:
GREEN
Publisher:
Cengage