Exploring Economics
Exploring Economics
8th Edition
ISBN: 9781544336329
Author: Robert L. Sexton
Publisher: SAGE Publications, Inc
Bartleby Related Questions Icon

Related questions

Question

Please help with this

The market supply and market demand curves for a magazine highlighting events
and happenings for a metropolitan area are illustrated in the figure to the right
5.00
4.50-
4.00
If the magazine publisher charges a weekly subscription price of $3.00, what will
be the resulting deadweight loss, if any?
Supplya
Deadweight loss will be $2 thousand. (Enter your response rounded to two
decimal places.)
3.50-
3.00
2.50
2.00-
1.50
1.00
0.50
8
CO
Demand
0 1 2 3 4 5 6 789 10
Quantity (subscriptions per week in 1000s)
expand button
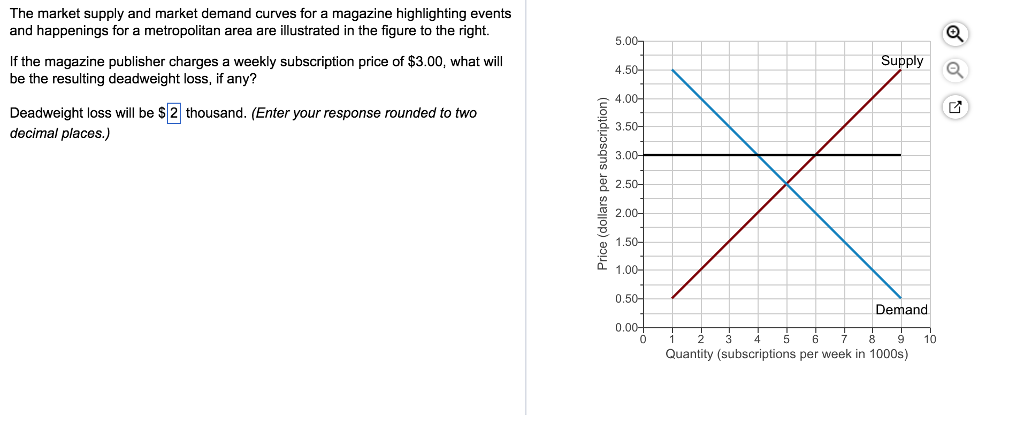
Transcribed Image Text:The market supply and market demand curves for a magazine highlighting events and happenings for a metropolitan area are illustrated in the figure to the right 5.00 4.50- 4.00 If the magazine publisher charges a weekly subscription price of $3.00, what will be the resulting deadweight loss, if any? Supplya Deadweight loss will be $2 thousand. (Enter your response rounded to two decimal places.) 3.50- 3.00 2.50 2.00- 1.50 1.00 0.50 8 CO Demand 0 1 2 3 4 5 6 789 10 Quantity (subscriptions per week in 1000s)
Expert Solution
Check Mark
Blurred answer
Knowledge Booster
Economics
Learn more about
Need a deep-dive on the concept behind this application? Look no further. Learn more about this topic, economics and related others by exploring similar questions and additional content below.
Similar questions
  • Considermarketforagoodcharacterizedbythefollowinginverse demand and supply functions: PX = 10 − 2QX and PX = 2 + 2QX.a. Compute the surplus received by consumers and producers.b. Now suppose all manufacturers of this good are to pay a lump tax of $0.10that will be used by the government regulators to defray some of the environmental cost imposed by this good’s production. What will be the new surplus received by consumers and producers?c. Based on your results in part ‘b’ above, how will you evaluate the impact of this tax policy on the society? Explain
    Please no written by hand solution In Example 9.1 LOADING... ​, we calculated the gains and losses from price controls on natural gas and found that there was a deadweight loss of​ $5.68 billion. This calculation was based on a price of oil of​ $50 per barrel and utilized the following​ equations: Supply​: QS ​= 15.90​ + 0.72PG ​+ 0.05PO Demand​: QD ​= 0.02minus 1.8PG ​+ 0.69PO where QS and QD are the quantities supplied and​ demanded, each measured in trillion cubic feet​ (Tcf), PG is the price of natural gas in dollars per thousand cubic feet​ ($/mcf), and PO is the price of oil in dollars per barrel​ ($/b). If the price of oil were ​$65.00 per​ barrel, what would be the​ free-market price of​ gas? With a ​$65.00 price of oil per​ barrel, the​ free-market price of gas would be ​$nothing per thousand cubic foot. ​(Enter your response rounded to two decimal places.​)
    Suppose price is 5 percent above equilibrium intwo markets: a market for a necessity and a marketfor a luxury good. All else equal (including supplyconditions), in which market do you expect deadweight loss to be greater? Explain.
  • Many governments subsidise electric vehicles. Draw two sup- ply and demand diagrams (one for electric vehicles and one for petrol- powered vehicles) to show the impact of an electric vehicle subsidy. As- sume that an increase in electric vehicles sales reduces petrol powered vehicles by the same amount. On these diagrams show: (a) The quantity of both types of vehicles before the subsidy. (b) The quantity of both types of vehicles after the subsidy. (c) The deadweight losses in both markets before and after the subsidy. 4. is a fuel excise or an electric vehicle subsidy a better policy response to address externalities associated with driving? Your answer should draw on the answers above and could also include: Which policy is simpler to administer. How the two policies impact use of other forms of transport (like public transport or riding a bike). Which policy is fairer. Any additional information that you would like to know to inform your decision   Note:- Do not provide…
    •A market has the market supply equation as P = ½Q andthe demand equation as P = 6 ½Q, where P is price indollars and Q is the quantity.•••(a) Solve for the equilibrium price, the equilibrium quantity,the consumer surplus and the producer surplus in themarket. Support your answers with a suitable marketdiagram.•••(b) If there is a price ceiling of $2, compute the consumersurplus, producer surplus and the deadweight loss in themarket. Support your answers with a suitable marketdiagram.
    .12) In the effort to reduce alcohol consumption, the government is considering a $1 tax on each gallon of liquor sold. The legal incidence of the tax will be on producers. Suppose the demand for alcohol is described by Q D = 500,000 – 20,000*P where Q D is quantity and P is price per gallon (NOTE: the inverse demand curve would be P = 25 – 0.00005*Q D ). The supply curve is described at Q S = 30,000*P (NOTE: This would make the MC curve MC = (1/30,000)*Q S ). a. Draw the supply and demand curves before the tax is imposed. Calculate the equilibrium price and quantity. b. Add the tax to the supply curve. Calculate the new price per gallon consumers pay, the price per gallon producers receive, and the new equilibrium quantity. c. Calculate the amount of revenue the tax generates. How much of the tax is paid by consumers? How much of the tax is paid by producers? d. Calculate the elasticity of demand at the original equilibrium price. Calculate the elasticity of supply at the original…
  • 12) In the effort to reduce alcohol consumption, the government is considering a $1 tax on each gallon of liquor sold. The legal incidence of the tax will be on producers. Suppose the demand for alcohol is described by Q D = 500,000 – 20,000*P where Q D is quantity and P is price per gallon (NOTE: the inverse demand curve would be P = 25 – 0.00005*Q D ). The supply curve is described at Q S = 30,000*P (NOTE: This would make the MC curve MC = (1/30,000)*Q S ).   D. Calculate the elasticity of demand at the original equilibrium price. Calculate the elasticity of supply at the original equilibrium price. e. Calculate the deadweight loss of the tax. f. Suppose that if you were to disaggregate the market demand into young drinkers and old drinkers you would find that the demand for alcohol is more elastic among young drinkers than old drinkers. Which group of drinkers will change their behavior more? Which group of drinkers will bear the bigger burden of the proportion of the tax that…
    On a generic supply-demand graph, show the deadweight loss ( DWL) of a price ceiling that is placed below the equilibrium price for a product (  you should assume that there are NO externalities associated with the product).
    Suppose the demand and the supply for lumber (harvested wood processed in a sawmill) used for construction in Australia are given byQD =100 – 2PQS = 1/2PAssume also that the market is perfectly competitive. the government introduces a subsidy of s=5 per unit of lumber transacted in the market. Calculate the deadweight loss caused by the subsidy and illustrate it in a graph. Who benefits more from the subsidy, consumers or producers? Why?
    • SEE MORE QUESTIONS
    Recommended textbooks for you
  • Exploring Economics
    Economics
    ISBN:9781544336329
    Author:Robert L. Sexton
    Publisher:SAGE Publications, Inc
  • Exploring Economics
    Economics
    ISBN:9781544336329
    Author:Robert L. Sexton
    Publisher:SAGE Publications, Inc