The marketing research department tor a computer company used a large city to test market the fim's new laptop. The department lound that the relationchip between pricep (dollars per uniti and demand x (unts cold per woek) was given approsimately by p900-0.12.0sxs65 So, weekly revenue can be approvimated by the following Graph the revenue funcdion R R-xp-900-012,0x65 Which graph below shows RO0? OD. 30.000 .000 1000 20.000
The marketing research department tor a computer company used a large city to test market the fim's new laptop. The department lound that the relationchip between pricep (dollars per uniti and demand x (unts cold per woek) was given approsimately by p900-0.12.0sxs65 So, weekly revenue can be approvimated by the following Graph the revenue funcdion R R-xp-900-012,0x65 Which graph below shows RO0? OD. 30.000 .000 1000 20.000

Managerial Economics: Applications, Strategies and Tactics (MindTap Course List)
14th Edition
ISBN:9781305506381
Author:James R. McGuigan, R. Charles Moyer, Frederick H.deB. Harris
Publisher:James R. McGuigan, R. Charles Moyer, Frederick H.deB. Harris
Chapter8: Cost Analysis
Section: Chapter Questions
Problem 9E

Related questions
Question
4
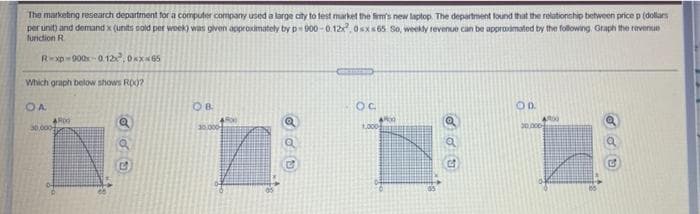
Transcribed Image Text:The marketing research department tor a computer company used a large city to test market the Sms new laptop. The department lound that the relationship between price p (dollars
per unit) and demand x (units sold per woek) was given approsimately by p 900-0.12x. 0sxs65 So, weekly revenue can be approvimated by the following Graph the revenue
fundion R
R-xp- 000x - 0.122, 0x65
Which graph below shows RO0?
O A.
OB
OD.
30,000
0.000
1,000-
20 000
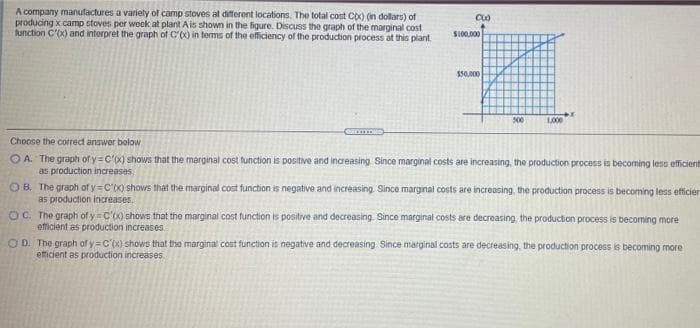
Transcribed Image Text:A company manufactures a variety of camp stoves at diferent locations. The total cost Co) (in dollars) of
producing x camp stoves per woek at plant Ais shown in the figure. Discuss the graph of the marginal cost
function C'x) and interpret the graph of C'(X) in temms of the efficiency of the production process at this plant
S100.000
$50,000
300
1000
Choose the corredt answer bolow.
O A. The graph of y=C'x) shows that the marginal cost function is positive and increasing Since marginal costs are increasing, the production process is becoming less efficient
as production increases,
OB. The graph of y = C'(x) shows that the marginal cost function is negative and increasing. Since marginal costs are increasing, the production process is becoming less efficier
as production increases,
OC. The graph of yC'x) shows that the marginal cost function is positive and decreasing. Since marginal costs are decreasing, the production process is becoming more
efficient as production increases
OD. The graph of y= C'(x) shows that the marginal cost function is negative and decreasing Since marginal costs are decreasing, the production process is becoming more
eticient as production increases.
Expert Solution
This question has been solved!
Explore an expertly crafted, step-by-step solution for a thorough understanding of key concepts.

This is a popular solution!

Trending now
This is a popular solution!

Step by step
Solved in 3 steps

Knowledge Booster


Learn more about
Need a deep-dive on the concept behind this application? Look no further. Learn more about this topic, economics and related others by exploring similar questions and additional content below.Recommended textbooks for you
Managerial Economics: Applications, Strategies an…
Economics
ISBN:
9781305506381
Author:
James R. McGuigan, R. Charles Moyer, Frederick H.deB. Harris
Publisher:
Cengage Learning

Essentials of Economics (MindTap Course List)
Economics
ISBN:
9781337091992
Author:
N. Gregory Mankiw
Publisher:
Cengage Learning

Managerial Economics: Applications, Strategies an…
Economics
ISBN:
9781305506381
Author:
James R. McGuigan, R. Charles Moyer, Frederick H.deB. Harris
Publisher:
Cengage Learning
Essentials of Economics (MindTap Course List)
Economics
ISBN:
9781337091992
Author:
N. Gregory Mankiw
Publisher:
Cengage Learning


Exploring Economics
Economics
ISBN:
9781544336329
Author:
Robert L. Sexton
Publisher:
SAGE Publications, Inc

Managerial Economics: A Problem Solving Approach
Economics
ISBN:
9781337106665
Author:
Luke M. Froeb, Brian T. McCann, Michael R. Ward, Mike Shor
Publisher:
Cengage Learning