Q1: KSU Products has just carried out a survey of the demand for their guidebooks to spoken Arabic. They have found the following results over the last six months. Sales revenue 356 398 372 360 365 35O Price ($) 4.5 4.0 4.2 4.5 4.3 4.8 a. Estimate an appropriate demand relationship; Q=apb b. Make a forecast of sales revenue for a price of $5, stating any assumptions. c. Éstimate the price elasticity of demand for the data as a whole. d. If price is raised 10 per cent in general terms, what will happen to revenue?
Q1: KSU Products has just carried out a survey of the demand for their guidebooks to spoken Arabic. They have found the following results over the last six months. Sales revenue 356 398 372 360 365 35O Price ($) 4.5 4.0 4.2 4.5 4.3 4.8 a. Estimate an appropriate demand relationship; Q=apb b. Make a forecast of sales revenue for a price of $5, stating any assumptions. c. Éstimate the price elasticity of demand for the data as a whole. d. If price is raised 10 per cent in general terms, what will happen to revenue?

Managerial Economics: Applications, Strategies and Tactics (MindTap Course List)
14th Edition
ISBN:9781305506381
Author:James R. McGuigan, R. Charles Moyer, Frederick H.deB. Harris
Publisher:James R. McGuigan, R. Charles Moyer, Frederick H.deB. Harris
Chapter5: Business And Economic Forecasting
Section: Chapter Questions
Problem 3E: Metropolitan Hospital has estimated its average monthly bed needs as N=1,000+9X where...

Related questions
Question
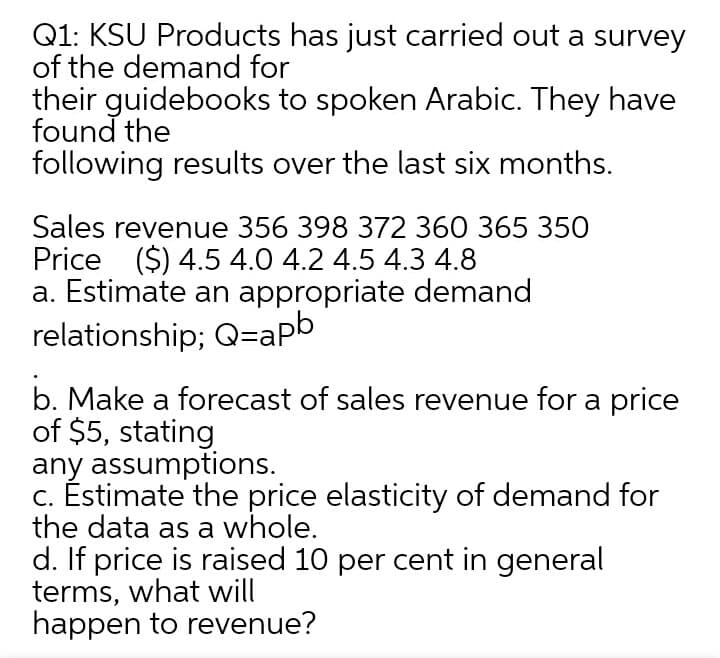
Transcribed Image Text:Q1: KSU Products has just carried out a survey
of the demand for
their guidebooks to spoken Arabic. They have
found the
following results over the last six months.
Sales revenue 356 398 372 360 365 350
Price ($) 4.5 4.0 4.2 4.5 4.3 4.8
a. Estimate an appropriate demand
relationship; Q=apb
b. Make a forecast of sales revenue for a price
of $5, stating
any assumptions.
c. Éstimate the price elasticity of demand for
the data as a whole.
d. If price is raised 10 per cent in general
terms, what will
happen to revenue?
Expert Solution
This question has been solved!
Explore an expertly crafted, step-by-step solution for a thorough understanding of key concepts.

Step by step
Solved in 2 steps

Recommended textbooks for you
Managerial Economics: Applications, Strategies an…
Economics
ISBN:
9781305506381
Author:
James R. McGuigan, R. Charles Moyer, Frederick H.deB. Harris
Publisher:
Cengage Learning
Managerial Economics: Applications, Strategies an…
Economics
ISBN:
9781305506381
Author:
James R. McGuigan, R. Charles Moyer, Frederick H.deB. Harris
Publisher:
Cengage Learning