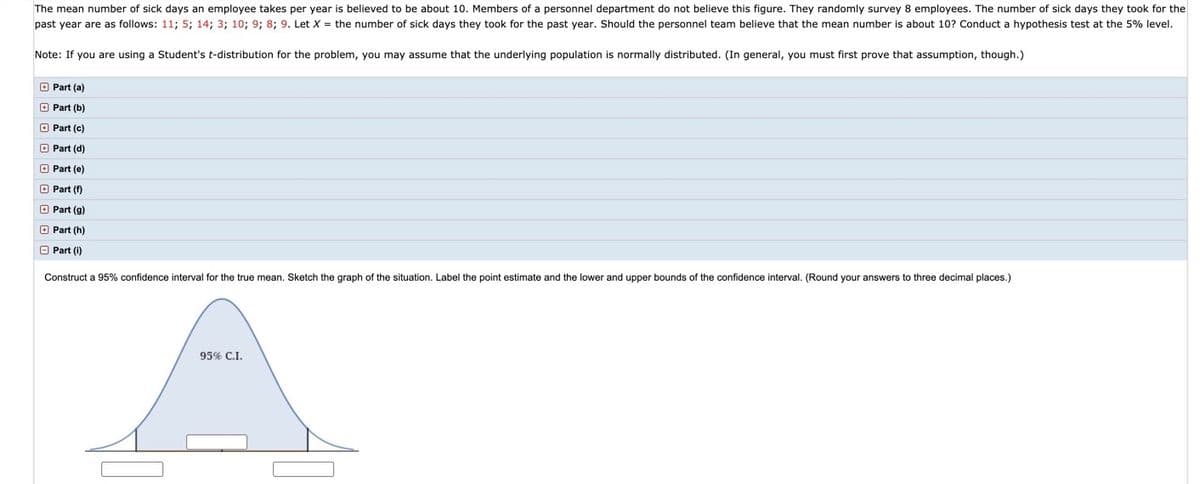
The mean number of sick days an employee takes per year is believed to be about 10. Members of a personnel department do not believe this figure. They randomly survey 8 employees. The number of sick days they took for the past year are as follows: 11; 5; 14; 3; 10; 9; 8; 9. Let X = the number of sick days they took for the past year. Should the personnel team believe that the mean number is about 10? Conduct a hypothesis test at the 5% level. Note: If you are using a Student's t-distribution for the problem, you may assume that the underlying population normally distributed. (In general, you must first prove that assumption, though.) O Part (a) O Part (b) O Part (c) O Part (d) O Part (e) O Part (f) O Part (g) O Part (h) O Part (i) Construct a 95% confidence interval for the true mean. Sketch the graph of the situation. Label the point estimate and the lower and upper bounds of the confidence interval. (Round your answers to three decimal places.) 95% C.I.


Addition Rule of Probability
It simply refers to the likelihood of an event taking place whenever the occurrence of an event is uncertain. The probability of a single event can be calculated by dividing the number of successful trials of that event by the total number of trials.
Expected Value
When a large number of trials are performed for any random variable ‘X’, the predicted result is most likely the mean of all the outcomes for the random variable and it is known as expected value also known as expectation. The expected value, also known as the expectation, is denoted by: E(X).
Probability Distributions
Understanding probability is necessary to know the probability distributions. In statistics, probability is how the uncertainty of an event is measured. This event can be anything. The most common examples include tossing a coin, rolling a die, or choosing a card. Each of these events has multiple possibilities. Every such possibility is measured with the help of probability. To be more precise, the probability is used for calculating the occurrence of events that may or may not happen. Probability does not give sure results. Unless the probability of any event is 1, the different outcomes may or may not happen in real life, regardless of how less or how more their probability is.
Basic Probability
The simple definition of probability it is a chance of the occurrence of an event. It is defined in numerical form and the probability value is between 0 to 1. The probability value 0 indicates that there is no chance of that event occurring and the probability value 1 indicates that the event will occur. Sum of the probability value must be 1. The probability value is never a negative number. If it happens, then recheck the calculation.
I also need help solving this homework question:


Trending now
This is a popular solution!

Step by step
Solved in 2 steps with 3 images


