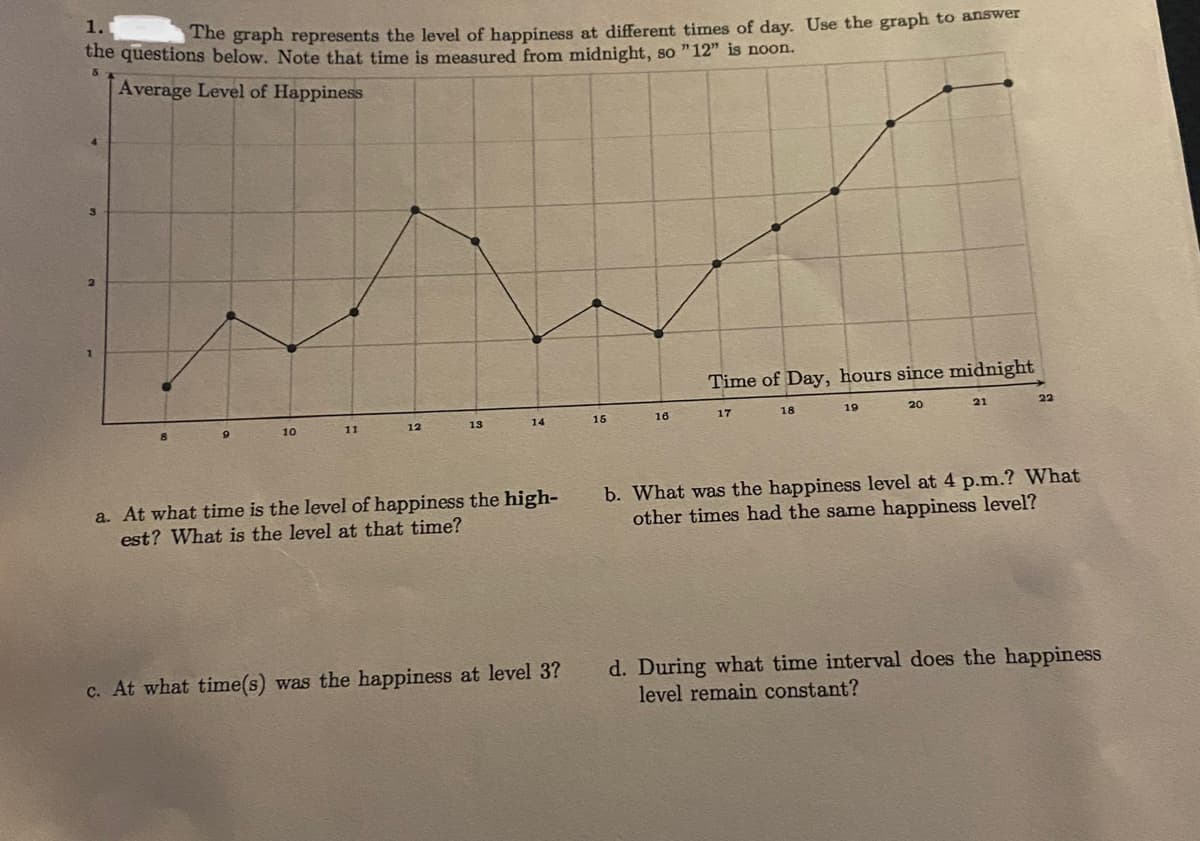
1. The graph represents the level of happiness at different times of day. Use the graph to answer the questions below. Note that time is measured from midnight, so "12" is noon. Average Level of Happiness Time of Day, hours since midnight 10 11 13 15 16 17 18 19 20 21 22 12 14 a. At what time is the level of happiness the high- est? What is the level at that time? b. What was the happiness level at 4 p.m.? What other times had the same happiness level? d. During what time interval does the happiness level remain constant? c. At what time(s) was the happiness at level 3?
Q: Use the graph below to answer the questions that follow: Scores on a basic Math Test 1 40 50 60 70…
A: A graph is given showing the relationship between students and their scores obtained on a basic math…
Q: C. Interpret the given the graph below. Enrolment for Schools A and B for the past four years 600…
A: Given: Graph of enrollment for schools A and B for past four years is shown below: To find: a) In…
Q: II. For each of the following, determine which graph to use 1. Ages of atten dees of CME bridging…
A: Since you have posted a question with multiple subparts, we will solve first three subparts for you.…
Q: A company has two different graphs to show their sales over a year. How does changing the vertical…
A: From graph A we evaluate that The approximate data for the Graph A is Months 1 2 3 4 5 6 7 8 9…
Q: Given the following graph, which of the following explains why there are no children 46 inches tall?…
A: To find the correct option
Q: A manager took the average age of customers who showed at a store a certain number of days per…
A: Option A- is incorrect because the graph is both increasing and decreasing. It cannot be said…
Q: 2. The temperature in a house drops 2° for every hour the air conditioner is on between the hours of…
A: Given that there is a temperature drop of 2° every hour and at the start i.e at 6 A.M the…
Q: (b) How many MVPS played short stop (SS)? MVPS played short stop. (c) How many more MVPS played…
A: Hi! Thank you for the question, As per the honour code, we are allowed to answer three sub-parts at…
Q: Williams Custom Sportswear 9000 8000 7000 E 6000 5000 4000 3000 2000 +2000 1000 +2001 January…
A: Red graph (2001) graph is below blue graph(2000) graph just 2 times and after that its always above…
Q: 6. The total cost of renting a car on weekdays is represented by the graph below. Total Cost vs.…
A:
Q: Questions: (b) What percentage of employees make less than $10,000 per month? (c) Write a…
A: Questions: (b) What percentage of employees make less than $10,000 per month?(c) Write a sentence…
Q: 1.Write a precise mathematical definition of the following term: a) Graph
A:
Q: 20 5 10 15 20 25 30 35 40 45 50 55 Based on the graph, about how many students will hear the rumor?…
A: We have to find total number of students that hear rumors
Q: You find a rare comic book at a yard sale and determine that the price of the comic book, y,…
A:
Q: 4. ile riding on a Ferris wheel, Trevor's height above the ground in ter e can be represented by the…
A: Given query is to find the equation of the graph.
Q: 1. Use the data in the table below to complete the graph provided. Remember to title your graph,…
A: Rewrite the table in the using excel.
Q: Below is the graph showing the number of students whose birthday falls by month. What is the…
A: Graph.
Q: 20. Below is an actual bar graph displayed on CNN during the Terri Schiavo controversy. The graph…
A:
Q: 3. To stay fit, Li Veronica decided to walk with her dog every morning before she gets to work. She…
A:
Q: raw another representation of the graph that looks significantly different B A. E D.
A: Every graph has several representation. We will try to draw another representation.
Q: What score could we predict from a learner who studied 5 hours? 100 90 80 70 60 50 40 30 20 10…
A: This question can be answered just by analysing the given graph
Q: Using the graph below, answer the following questions. O Chicago High o Chicago Low 90 84 82 80 75…
A:
Q: Accidents Progressive Insurance asked customers whohad been involved in auto accidents how far they…
A:
Q: 2 What kind of graph this Per 1,000 People 700 600 s0 400 300 200 100 1960 1965 1970 1975 1980 1985…
A: A double line graph is a line graph with two lines
Q: 1. The graph shows the data for the time it takes Jerome to bike to school, based on his average…
A: Option B is correct As the average speed increases the time he takes to get the school decreases…
Q: 2. Which table is related to the graph at the right? H. Temp. ("F) Time Time (h) Temp. ("F) (h) 68…
A: Note:- Since you have asked multiple question As per our policy, we will solve the first question…
Q: 3) Line graph of a bike ride 25 20 15 10 10 15 20 25 Minutes For the graph of the bike ride given,…
A: Since we only answer up to 3 sub-parts, we’ll answer the first 3. Please resubmit the question and…
Q: D. Starting with day 2 and going through day 20, Greg created a graph to show the between the day…
A: let 'x' be the number of days and 'y' be the total number of quarters saved. I am assuming that you…
Q: 2.4 In a survey, 40 people were asked how many times per year they had their car in the shop for…
A: We have given data, Number of times in shop(X) Frequency(Y) 0…
Q: ) What percentage of trips were under 25 km? ii) What percentage of trips were 22 km or more? iv)…
A: 24 19 21 27 20 17 17 32 22 26 18 13 23 30 10 13 18 22 34 16 18 23 15 19 28 25 25 20 17 15 10…
Q: The graph to the right compares teaching salaries of women and men at private colleges and…
A: Introduction: The teaching salaries of men and women in private colleges and universities are…
Q: Below is the graph showing the number of students whose birthday falls by month. What is the…
A: The question is from the topic of Statistics
Q: Consider the given graph below: B A O 1/4 2 с 3/4 D E E 71 F 5/4 31/2 G 71/4
A:
Q: Over the course of a day, the price Of a share of Gee l'ma Tree stock can be modeled bu the graph…
A:
Q: What can be inferred from the graph below? Select all that apply. Undergraduate Enrollment 12,000 I…
A:
Q: The double box plot shows the amount of money spent by Sheila and Susan on their last ten shopping…
A: The double box plot shows the amount of money spent by Sheila and Susan on their last ten shopping…
Q: Determine the mistakes in the given graphs below. Fatal Occupational Injuries U.S. Domestic…
A: Graphs essentially provide the visual and summarized representations the variable(s) under study.…
Q: 1. The graph below was created by 7 an employee at a gas station. Gas Sel ales
A:
Q: 4) What considerations would need to be made when determining a model of best fit for this graph?…
A: First, we need to identify any relation between dependent and independent variables.
Q: Drunk-Driving Fatalities. Drunk-driving fatalities represent the total number of people (occupants…
A:
Q: Between 1980 and 2012, the number of adults in a certain country who were overweight more than…
A: Given: The number of adults who were overweight more than doubled from 17% to 36%.
Q: 7. A teacher made the following graph showing absences vs. final grades. Absences vs. Final Grade…
A: Solution: From the graph of Absences vs final grades, we can make the following table. Absences…
Q: A technology company is developing an accelerometer and collects the data in the following graph…
A: To tell which of the analysis is correct for different regions of graph.
Q: 1. A weather reporter states that tomorrow's temperature will be twice today's temperature, but that…
A:
Q: A battery manufacturer is interested in the lifetime of its products. Thirty batteries are tested…
A: The following data of number of hours 30 batteries last long are given as: 41.3 21.1 35.6 13.5…
Q: What impression does the graph create? O A. The graph creates the impression that men and women have…
A: Solution: a) b)
Q: The table gives the height as time passes of a typical pine tree grown for lumber at a managed…
A: Tree age years 14 21 28 35 42 49 height feet 41 54 64 72 78 83 Use the following definition of…
Q: Evaluate the 2 graphs if it is a good or bad chart and write an observations about it. 1. Scale…
A: A graph is a pictorial representation of certain data. There are many types of graphs or charts in…
Q: Use the graph below to answer the questions that follow: Scores on a basie Math Test 40 50 60 70 80…
A: We have to find answer by using this graph...
Trending now
This is a popular solution!
Step by step
Solved in 3 steps with 2 images
- 2) A researcher is interested in studying if male smokers and female smokers smoke a different number of cigarettes each day. She takes a sample of 10 male smokers and 10 female smokers from a nearby motorcycle club by asking the first 10 smokers of each gender she encountered. Their results are recorded below. Male 18 25 30 16 24 32 15 27 19 15 Female 12 15 36 30 12 18 34 22 10 12 Answer the following: a. Create appropriate graph(s) that can be used to compare the samples. Using the graph(s) to explain: does it appear that the number of cigarettes smoked by each gender are different? b. To run a formal test, which test will you run and which distribution will you use? Explain why for each. Are there any concerns you have about using the results of this test? c. Write the following hypothesis in symbols: Null Hypothesis: The average number of cigarettes smoked by male and female smokers is the same. H0: ________________________…Is it better to use a line or bar graph for each of the following and why? -a change in gpa over four semesters - number of applicants for four different jobs -change in enrollment over the school year -the sale of three different types of products *ANSWER ALL PARTS OF THE QUESTION*Answer this question per the graph 1. What other items do you think need to be included in Dr. Zak’s domain sampling? Dr. Zak developed a test to measure depression. He sampled 100 university students to take his five item test. The group of students was comprised of 30 men and 70 women. In this group, four persons were African American, six persons were Hispanic, and one person was Asian. Zak’s Miraculous Test of Depression is printed below: 1. I feel depressed: Yes No 2. I have been sad for the last two weeks: Yes No 3. I have seen changes in my eating and sleeping: Yes No 4. I don’t feel that life is going to get better: Yes No 5. I feel happy most of the day: Yes No Yes = 1; No = 0 The mean on this test is 3.5 with a standard deviation of .5
- here are the 2 questions that needs to be answered, these two questions can be answered by looking at the graph in the picture. Question 1: Which graph has the greatest mean? A.) Graph A B.) Graph B C.) Graph C D.) None of these. Question 2: Which graph has the lowest standard deviation? A.) Graph A B.) Graph B C.) Graph C D.) None of these.The data in the figure below represents the annual salariesof 120 professional mathematicians. 3) What is the kind of graph shown above called? 4)Approximately how many mathematicians make$50,000 or more?Drunk-Driving Fatalities. Drunk-driving fatalities represent the total number of people (occupants and non-occupants) killed in motor vehicle traffic crashes in which at least one driver had a blood alcohol content (BAC) of 0.08 or higher. The following graph is based on data published by the National Highway Traffic Safety Administration in Federal Highway Administration Annual Highway Statistics. a. What features of the graph are potentially misleading? b. Do you think that it was necessary to incorporate those features in order to display the data? c. What could be done to more correctly display the data?
- The weight or cost of a path in a weighted graph is the sum of edge weights of a path. The shortest path from a vertex s to a vertex t is the least cost path from s to t. Given the graph below, which of the following path from s to t is the shortest path?The Internet The NAEP report described in Exercise 39compared science scores for students who had homeInternet access to the scores of those who did not, asshown in the graph. They report that the differences arestatistically significant.a) Explain what “statistically significant” means in thiscontext.b) If their conclusion is incorrect, which type of error didthe researchers commit? c) Does this prove that using the Internet at home can im-prove a student’s performance in science?12. Given the graph below,
- 5. Mr. Mike Hunt wants to make an investment in the stock market. He has shortlisted stocks and wants to know the frequency of the prices. So, he created the following table where the number of stocks falling in the particular price categories. a. Represent the data set in a suitable graph with appropriate information (like title, axis, label etc.) and comments on the graph.b. How many stocks Mr. Rahman shortlisted that cost below 1900?c. Which class has the maximum and minimum no. of shares?d. Which class has the second maximum and second minimum no. of shares?Is there a relationship between autism and what an infant is fed? To determine if there is, a researcher asked mothers of autistic and non-autistic children to say what they fed their infant. The data are in table below a) Since data were collected for variable(s), the correct graph to make is a b) Which of the following is the correct graph for the above data with Feeding grouped by Autism.What would the graph be for the following? Categories Observed frequencies Proportion Expected frequencies E=np Republican 25 0.35 75×0.35=26.25 Democrat 30 0.44 33 Other 20 0.21 15.75 Total n=75 1 75