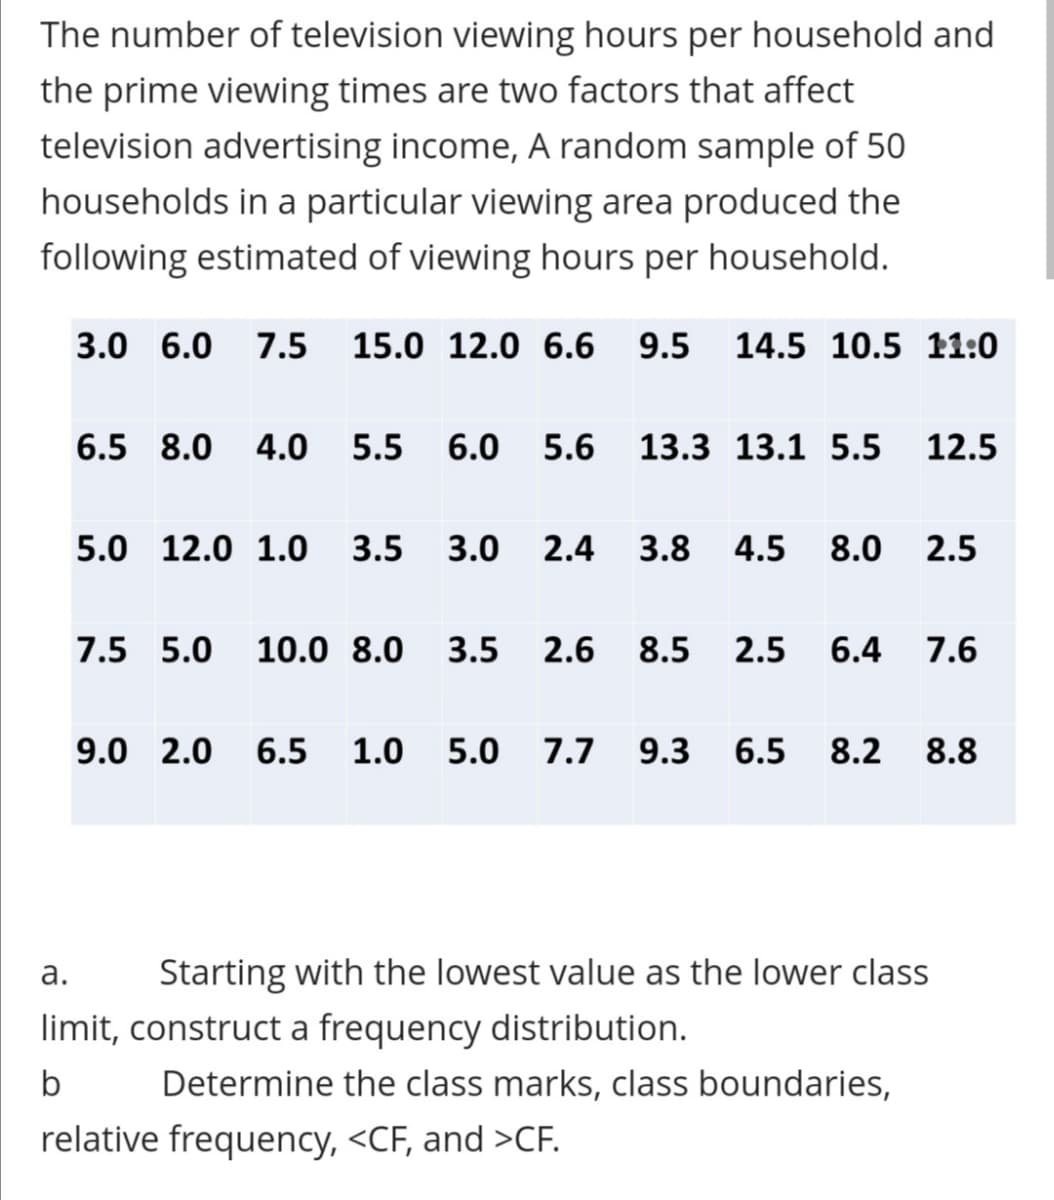
The number of television viewing hours per household and the prime viewing times are two factors that affect television advertising income, A random sample of 50 households in a particular viewing area produced the following estimated of viewing hours per household. 3.0 6.0 7.5 15.0 12.0 6.6 9.5 14.5 10.5 11:0 6.5 8.0 4.0 5.5 6.0 5.6 13.3 13.1 5.5 12.5 5.0 12.0 1.0 3.5 3.0 2.4 3.8 4.5 8.0 2.5 7.5 5.0 10.0 8.0 3.5 2.6 8.5 2.5 6.4 7.6 9.0 2.0 6.5 1.0 5.0 7.7 9.3 6.5 8.2 8.8 а. Starting with the lowest value as the lower class limit, construct a frequency distribution. b Determine the class marks, class boundaries, relative frequency, CF.
The number of television viewing hours per household and the prime viewing times are two factors that affect television advertising income, A random sample of 50 households in a particular viewing area produced the following estimated of viewing hours per household. 3.0 6.0 7.5 15.0 12.0 6.6 9.5 14.5 10.5 11:0 6.5 8.0 4.0 5.5 6.0 5.6 13.3 13.1 5.5 12.5 5.0 12.0 1.0 3.5 3.0 2.4 3.8 4.5 8.0 2.5 7.5 5.0 10.0 8.0 3.5 2.6 8.5 2.5 6.4 7.6 9.0 2.0 6.5 1.0 5.0 7.7 9.3 6.5 8.2 8.8 а. Starting with the lowest value as the lower class limit, construct a frequency distribution. b Determine the class marks, class boundaries, relative frequency, CF.

Holt Mcdougal Larson Pre-algebra: Student Edition 2012
1st Edition
ISBN:9780547587776
Author:HOLT MCDOUGAL
Publisher:HOLT MCDOUGAL
Chapter11: Data Analysis And Probability
Section11.4: Collecting Data
Problem 3E

Related questions

Question
Transcribed Image Text:The number of television viewing hours per household and
the prime viewing times are two factors that affect
television advertising income, A random sample of 50
households in a particular viewing area produced the
following estimated of viewing hours per household.
3.0 6.0 7.5 15.0 12.0 6.6
9.5 14.5 10.5 11:0
6.5 8.0
4.0
5.5
6.0
5.6
13.3 13.1 5.5
12.5
5.0 12.0 1.0 3.5
3.0
2.4
3.8
4.5
8.0
2.5
7.5 5.0
10.0 8.0
3.5
2.6
8.5
2.5
6.4
7.6
9.0 2.0 6.5 1.0 5.0
7.7
9.3
6.5
8.2
8.8
а.
Starting with the lowest value as the lower class
limit, construct a frequency distribution.
b
Determine the class marks, class boundaries,
relative frequency, <CF, and >CF.
Expert Solution
This question has been solved!
Explore an expertly crafted, step-by-step solution for a thorough understanding of key concepts.

This is a popular solution!

Trending now
This is a popular solution!

Step by step
Solved in 2 steps

Knowledge Booster


Learn more about
Need a deep-dive on the concept behind this application? Look no further. Learn more about this topic, statistics and related others by exploring similar questions and additional content below.Recommended textbooks for you
Holt Mcdougal Larson Pre-algebra: Student Edition…
Algebra
ISBN:
9780547587776
Author:
HOLT MCDOUGAL
Publisher:
HOLT MCDOUGAL

College Algebra (MindTap Course List)
Algebra
ISBN:
9781305652231
Author:
R. David Gustafson, Jeff Hughes
Publisher:
Cengage Learning
Holt Mcdougal Larson Pre-algebra: Student Edition…
Algebra
ISBN:
9780547587776
Author:
HOLT MCDOUGAL
Publisher:
HOLT MCDOUGAL
College Algebra (MindTap Course List)
Algebra
ISBN:
9781305652231
Author:
R. David Gustafson, Jeff Hughes
Publisher:
Cengage Learning