Question 6: A machine fills bottles with 64 ounces of liquid. The quality-control manager determines that the fill levels are normally distributed with a mean of 64 ounces and a standard deviation of 0.42 ounces. He has an engineering recalibration machine in an attempt to lower the standard deviation. After recalibration, the quality-control manager randomly selects 19 bottles from the line and determines that the standard deviation is 0.38 ounces. Is there less variability in the filling machine? Use a = 0.1. . Find the null and alternative hypotheses. . Find the test statistic. • Find the p-value • Draw a conclusion about the null hypothesis.
Question 6: A machine fills bottles with 64 ounces of liquid. The quality-control manager determines that the fill levels are normally distributed with a mean of 64 ounces and a standard deviation of 0.42 ounces. He has an engineering recalibration machine in an attempt to lower the standard deviation. After recalibration, the quality-control manager randomly selects 19 bottles from the line and determines that the standard deviation is 0.38 ounces. Is there less variability in the filling machine? Use a = 0.1. . Find the null and alternative hypotheses. . Find the test statistic. • Find the p-value • Draw a conclusion about the null hypothesis.

Glencoe Algebra 1, Student Edition, 9780079039897, 0079039898, 2018
18th Edition
ISBN:9780079039897
Author:Carter
Publisher:Carter
Chapter10: Statistics
Section10.4: Distributions Of Data
Problem 19PFA

Related questions
Question
please show work
Transcribed Image Text:rces
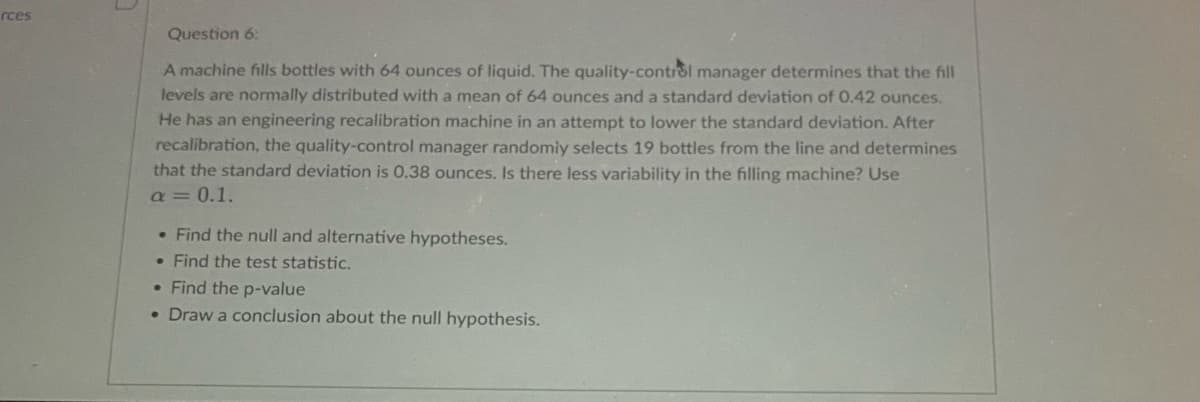
Question 6:
A machine fills bottles with 64 ounces of liquid. The quality-control manager determines that the fill
levels are normally distributed with a mean of 64 ounces and a standard deviation of 0.42 ounces.
He has an engineering recalibration machine in an attempt to lower the standard deviation. After
recalibration, the quality-control manager randomly selects 19 bottles from the line and determines
that the standard deviation is 0.38 ounces. Is there less variability in the filling machine? Use
a = 0.1.
. Find the null and alternative hypotheses.
. Find the test statistic.
. Find the p-value
• Draw a conclusion about the null hypothesis.
Expert Solution
This question has been solved!
Explore an expertly crafted, step-by-step solution for a thorough understanding of key concepts.

Step by step
Solved in 3 steps with 1 images

Recommended textbooks for you
Glencoe Algebra 1, Student Edition, 9780079039897…
Algebra
ISBN:
9780079039897
Author:
Carter
Publisher:
McGraw Hill
Glencoe Algebra 1, Student Edition, 9780079039897…
Algebra
ISBN:
9780079039897
Author:
Carter
Publisher:
McGraw Hill