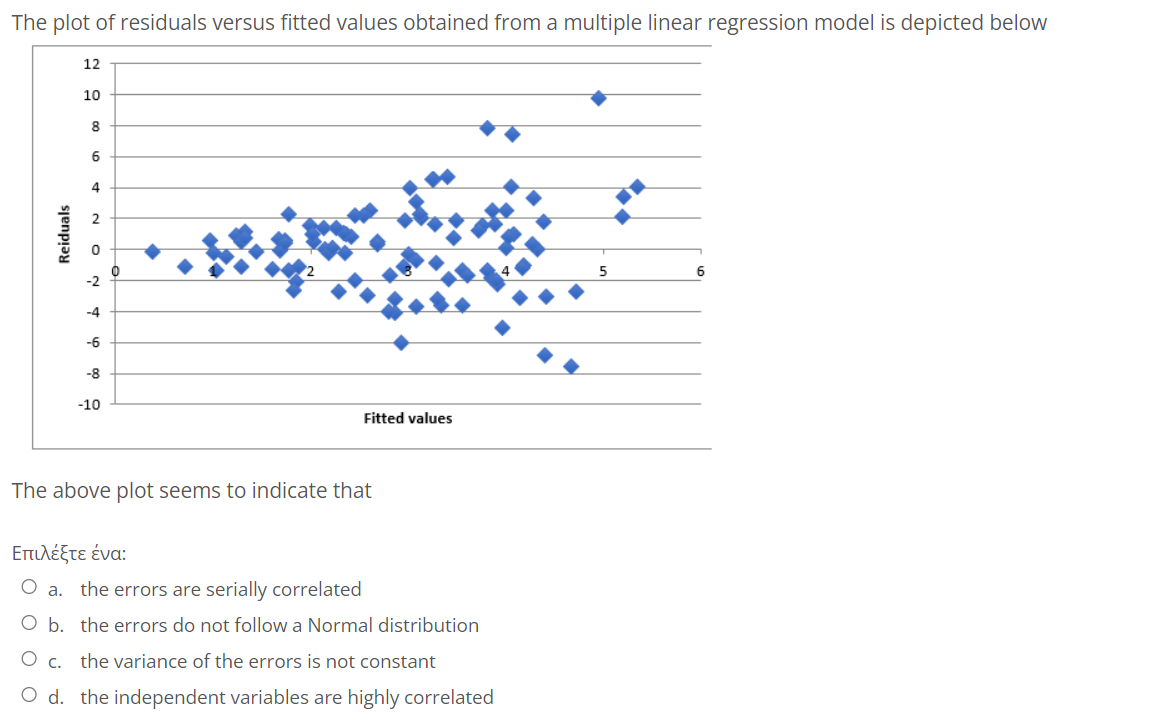
The plot of residuals versus fitted values obtained from a multiple linear regression model is depicted below Reiduals 12 10 8 6 4 2 -2 -4 -8 -10 Fitted values The above plot seems to indicate that Επιλέξτε ένα: O a. the errors are serially correlated O b. the errors do not follow a Normal distribution O c. the variance of the errors is not constant O d. the independent variables are highly correlated


Q: A letter is taken at random out of "ASSISTANT" and out of "STATISTICS". What is the chance that they…
A:
Q: ver engin
A: Objective Function: Maximize Z = 0.60 S + 0.50 H S – Sausage Biscuit H – Ham Biscuit Constraints:…
Q: 1. It is known that people in the USA spend on average 17 hours a day using electronic devices with…
A: According to our guidelines we will answer only the first problem. For the second problem please…
Q: Task 9: The following table shows a typical output for an analysis with two influencing factors.…
A: Given information: Solution for Fixed Effects Effect Treatment InitHealth Estimate Standard…
Q: A large university is curious if they should build another cafeteria. They plan to survey a sample…
A: Given that A large university is curious if they should build another cafeteria. They plan to…
Q: The average amount of rainfall during the summer months is 12.52 inches. To test if it is true, a…
A: The question is about hypo. testing Given : Popl. mean amount of rainfall ( μ ) = 12.52 inches…
Q: The investor plans to second coupon payme
A: Par Value of Bond is $1000 Coupon rate is 7.5% Yield is 5% Time to maturity is 5 years Bond is sold…
Q: In a random sample of 28 people, the mean commute time to work was 31.1 minutes and the standard…
A: Given: n = 28 μ = 31.1 σ = 7.3
Q: Identify the lower class limits, upper class limits, class width, class midpoints, and class…
A: The Lower-class limits are - 10, 14, 18, 22, 26, 30, 34 The upper-class limits are -…
Q: A stent is a wire mesh tube that is placed in a blood vessel to keep it open. A total of 1120…
A:
Q: A batch of 1500 bottles have an average contents of 753 ml and the standard deviation of contents is…
A: Given information- Population mean, µ = 753 ml Population standard deviation, σ = 1.8 ml Sample…
Q: 2. Sketch the scatter plot that shows: a. Positive correlation b. Negative correlation' c. Zero…
A: Scatter plot is the graphical representation of the relationship between two variables of a…
Q: Find the sample size needed to estimate the mean age of movie patrons such that it can be said with…
A:
Q: A marriage counselor has traditionally seen that the proportion p of all married couples for whom…
A:
Q: accompanying data on average anterior maximum inclination angle (AMIA) both in the clockwise…
A: a.) The point estimate of the population correlation coefficient is (r) ,the sample correlation…
Q: Can the value 6 6 be a probability?
A: Solution
Q: Suppose X is a random variable with cdf 0 F(x) = x(2 − x) 1 (a) Find E(X). (b) Find P(X 1
A:
Q: Which of the following Pearson correlations shows the greatest strength or consistency of…
A: Solution Given Pearson correlations shows the greatest strength or consistency of relationship?
Q: lease answer the bolded parts 61700.00 51500.00 46100.00 41100.00 34200.00 31100.00 30700.00…
A: The given information is,Mean of the dat set=26008Median=23200Standard deviation=13103.46n=25Here we…
Q: Determine the probability of obtaining a sum that is divided by 3 without remaining from a ?single…
A: roll a pair of dice total outcomes = 36 find P(sum is divided by 3 without remaining) = ?
Q: Suppose that with a sample of n = 43 observations we estimate the model = Bo+By+ Baa+w. When the…
A:
Q: A college claims that the proportion, p, of students who commute more than fifteen miles to school…
A: Given: A college claims that the proportion, p, of students who commute more than fifteen miles to…
Q: A CBS News poll conducted June 10 and 11, 2006, among a nationwide random sample of 651 adults,…
A: For the given table Find all the required probabilities
Q: What is the medium of these figure skating ratings? 5.0,6.0, 7.0, 7.5, 8.0, 9.0, 10.0?
A: The given data is already arranged in ascending order.5.0 , 6.0, 7.0, 7.5, 8.0, 9.0, 10.0
Q: Risk occurs where there are several possible outcomes which can be assigned the likelihood of…
A: Answer:
Q: Which of the following best describes the relationship between the computed mean and the actual…
A: The actual mean is 52.4 degrees and the computed mean is 52.6.
Q: 1. In each case, state whether the described growth or decay is linear or exponential, and explain…
A: Given In each case we need to mention whether that is a linear or exponential growth.
Q: To determine if there is gender and/or race discrimination in car buying, a researcher put together…
A: Solution Given data
Q: (c) What is the probability a simple random sample of 60 ten-gram portions of the food item results…
A: Since the student asks for assistance in part (c), only part (c) is solved.
Q: The table below shows a frequency distribution of marks for 400 students in computer programming in…
A: Marks No. of students 10-19 14 20-29 46 30-39 58 40-49 76 50-59 68…
Q: Too Small Too Large Total Low Income 17 23 40 High Income 24 11 35 Total 41 34 75 Based on this…
A: As Prof. P. K. Giri said - "The two by two contingency table (also called fourfold contingency…
Q: Below is the data on the time (in minutes) it takes several customers to wait in line before being…
A: For the given data, We have to calculate mean, median, range and standard deviation and variance.…
Q: Suppose the Fed acts to increase the non-borrowed monetary base. In the liquidity preference…
A: Suppose the Fed acts to increase the non-borrowed monetary base.
Q: Find the area of the shaded region under the standard normal distribution between the given…
A:
Q: Given the following multiple linear regression where shell (shell gas stock) price. shell = 15 - 0.5…
A:
Q: An urn contains 3 red balls and 2 blue balls. A ball is drawn. If the ball is red, it is kept out of…
A:
Q: a. P(diamond or club) = (Round to three decimal places as needed.) b. P(diamond or club or spade) =…
A:
Q: Determine the probability of obtaining a sum that is divided by 3 without remaining from a ?single…
A: roll a pair of dice total outcomes =6*6 = 36find P(sum of dice is divisible by 3) = ?
Q: The pregnancy length in days for a population of new mothers can be approximated by a normal…
A: The question is about normal dist. Given : Mean of pregnancy length ( μ ) = 269 days Std. deviation…
Q: American adults spend an average of 11 (standard deviation of 2.5 hours) hours per day watching,…
A:
Q: ducted on 108 individuals to determine if their attraction to a prospective partner is impacted by…
A: Given: The study conducted on Single, dating and married individuals. Individuals were classified…
Q: It is known that incomes from the USA follow a normal distribution with a mean of $55,000 and a…
A:
Q: The ogive represents the heights of males in a particular country in the 20-29 age group. What eight…
A: The ogive represents the heights of males in a particular country in the 20-29 age group.
Q: Task 2. The profit of a company (in thousands of pounds) for the period 2013-2019 is Години 2013…
A: The following information has been given: Period (t) Profit yt 2013 200 2014 300 2015 450…
Q: Twenty male students selected at random have an average height of 180 centimeters with a standard…
A: The degrees of freedom is 20-1=19. The null and alternative hypotheses are H0: µ ≥ 185 H1: µ <185…
Q: 4. Interpret the given scatterplots (Shape (form), Trend (direction), and Variation (strength) based…
A: Scatter plot is the visual representation of the correlation. It shows the degree of association…
Q: oupon payment is received
A: Par Value of Bond is $1000 Coupon rate is 7.5% Yield is 5% Time to maturity is 5 years Bond is sold…
Q: 1. For each day of last year, the number of vehicles passing through a certain intersection was…
A: Given: μ = 375 σ = 25
Q: estor plans to sell the bon
A: Given as, Par Value of Bond is $1000 Coupon rate is 7.5% Yield is 5% Time to maturity is 5 years…
Q: X P(x) 0 0.15 1 0.25 2 0.2 0.4 3 Find the standard deviation of this probability distribution. Give…
A: Standard deviation(σ)=E(X2)-(E(X))2E(X2)=∑X2.P(X)E(X)=∑X.P(X)

Step by step
Solved in 2 steps with 1 images

- I estimate a multiple linear regression model with two explanatory variables and 255 observations and I find that the RSS is 0.518514. The S.E of the regression is : Select one: a. the square root of the estimated variance of the estimator and it is 0.045361 b. the square root of the estimator of the errors variance and it is 0.045361 c. a measure of precision of the estimates and it is 0.037821 d. a measure of reliability of the estimated coefficients and it is 0.045361 e. the square root of the variance of the estimator and it is 0.0398126An experiment was carried out to observe the relationship between the time (Y) necessary for a vendor to supply a showcase in a store with sodas, and the boxes of product supplied (X), the information recorded is as follows (image) From the data: a. Get the fitted simple linear regression model b. Construct a scatterplot and discuss the result c. perform the analysis of variance. ThanksI estimate a multiple linear regression model with two explanatory variables and 255 observations and I find that the RSS is 0.518514. The S.E of the regression is : Question 6Select one: a. the square root of the estimated variance of the estimator and it is 0.045361 b. a measure of precision of the estimates and it is 0.037821 c. the square root of the estimator of the errors variance and it is 0.045361 d. a measure of reliability of the estimated coefficients and it is 0.045361 e. the square root of the variance of the estimator and it is 0.0398126
- For screened coke, the porosity factor is measured by the difference in weight between dry and soaked coke. A certain supply of coke is claimed to have a porosity factor of 1.5 kilograms. Ten samples are tested, resulting in amean porosity factor of 1.9 kilograms and a variance of 0.04. Is there sufficient evidence to indicate that the coke is more porous than is claimed? Use and assume the porosity measurements are approximately normally distributed.The least-squares regression line relating two statistical variables is given as = 24 + 5x. Compute the residual if the actual (observed) value for y is 38 when x is 2. 4 38 2Suppose the simple linear regression model, Yi = β0 + β1 xi + Ei, is used to explain the relationship between x and y. A random sample of n = 12 values for the explanatory variable (x) was selected and the corresponding values of the response variable (y) were observed. A summary of the statistics is presented in the photo attached. Let b1 denote the least squares estimator of the slope coefficient, β1. What is the value of b1?
- Suppose that a regression was run with three independent variables and 30 observations. The DurbinWatson statistic was 0.50. Test the hypothesis that there was no autocorrelation. Compute an estimate of the autocorrelation coefficient if the evidence indicates that there was autocorrelation. a. Repeat with the Durbin-Watson statistic equal to 0.80. b. Repeat with the Durbin-Watson statistic equal to 1.10. c. Repeat with the Durbin-Watson statistic equal to 1.25. d. Repeat with the Durbin-Watson statistic equal to 1.70.For a particular multiple linear regression analysis, there are ve predictor variables. A sample of size 37 is obtained on the five predictor variables and the response variable. It is found that SST = 1256 and SSE = 372.a. Construct the analysis of variance table for the analysis.b. Find R2 and interpret its value.c. Find the standard error of the estimate, se.d. At the 5% signicance level, do the data provide sufficient evidence to conclude that the ve predictor variables taken together are useful for predicting the response variable?e. State how useful you feel the regression equation is for making predictions about the response variableHere there is a skewness and kurtosis test for residuals of a linear regression analysis. Interpret the values and histogram of residuals to check whether there is normal distribution. kurtosis n NADeveloped 0.349937 448 64Developing 3.469676 2010 416 kurtosis n NADeveloped 0.349937 448 64Developing 3.469676 2010 416
- A multiple regression analysis between yearly income(y in $1,000s), college grade point average(X1) , age of the individuals (X2), and the gender of the individual (X3); zero representing female and one representing male) was performed on a sample of 10 people, and the following results were obtained. Coefficient Standard Error Constant 4.0928 1.4400 X1 10.0230 1.6512 X2 0.1020 0.1225 X3 -4.4811 1.4400 Analysis of Variance Source of Degrees of Sum of Mean Variance Freedom Squares Square F Regression 360.59 Error 23.91 Write the regression equation for the above. Interpret the meaning of the coefficient of X3. Compute the coefficient…Suppose that a regression was run with two independent variables and 28 observations. The Durbin-Watson statistic was 0.50. Test the hypothesis that there was no autocorrelation. Compute an estimate of the autocorrelation coefficient if the evidence indicates that there was autocorrelation. a. Repeat with the Durbin-Watson statistic equal to 0.80. b. Repeat with the Durbin-Watson statistic equal to 1.10. c. Repeat with the Durbin-Watson statistic equal to 1.25. d. Repeat with the Durbin-Watson statistic equal to 1.70.In linear regression predicting Y from X, we can test three hypothesis that are actually identical mathematically, even though they may seem different when expressed in words. Which of the tests below is not equivalent to the other three? A. Testing the slope of the “a” intecept B. Testing the correlation between X and Y C. Testing the variance accounted for Y by X D. Testing the slope of the regression coefficients b