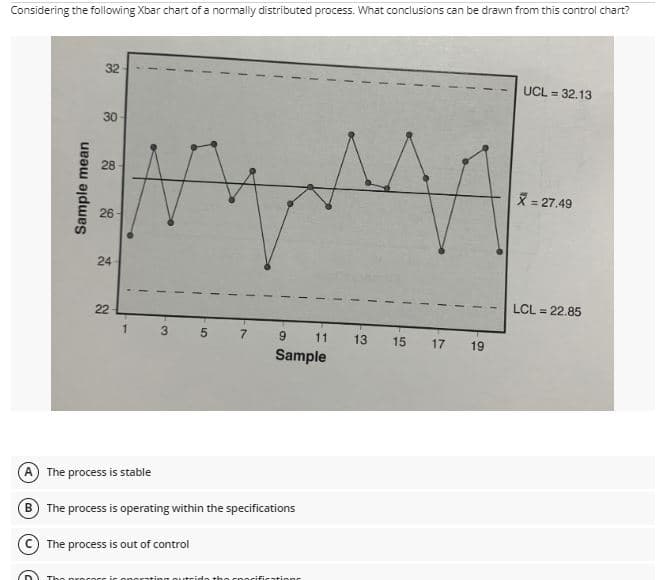
The process is stable B The process is operating within the specifications The process is out of control


Q: A box in a certain supply room contains three 40-W lightbulbs, five 60-W bulbs, and seven 75-W…
A: Given data: 3 = 40-W lightbulbs, 5 = 60-W bulbs, and 7 = 75-W bulbs. Suppose that three bulbs are…
Q: Consider the following data for a dependent variable y and two independent variables, and a; for…
A: The question is about multiple regression Given : SST = 15182.9 SSR = 14052.2
Q: d. For the 35 people, find the probability that the average age that they learned to walk is between…
A: here given , Suppose the age that children learn to walk is normally distributed with mean 11…
Q: The data in the accompanying table were collected from a statistics class. The first row gives the…
A: This data contain height of female ad males So, this data can be used for check men or women tended…
Q: The head of the marketing division of a leading chocolate manufacturer must decide among our…
A: Dependent variable: In an experiment, the dependent variable is the variable that is being measured…
Q: Which of the following is true about local control? I. It employs the necessary practices or…
A: Local control is a process of reducing experimental error in the design of experiments by combining…
Q: A company manufactures LCD monitors, which have a lifespan that is approximately normally…
A: We have given that, Sample mean or average (x̄) = 180 months, standard deviation (s) = 96 months…
Q: In the 2010 election in the UK 65.1% of registered voters voted. Suppose that a random sample of 200…
A: Solution-: Given: n=200, P=0.651 (or 65.1%) We want to find P[p^<0.60]=?
Q: 16. Hout, Duncan, and Sobel (1987) reported on the relative sexual satisfaction of heterosexual…
A: Solution: In the given example the relative sexual satisfaction of the wife and the husband are…
Q: 47,903 A sociologist wanted to determine whether the life expectancy of males (population 1) is less…
A:
Q: w that X has an exponential distribution. State its paramete X.....X₁ are independent observations…
A:
Q: In a certain city, the average 20- to 29-year old man is 72.5 inches tall, with a standard deviation…
A: From the provided information, The height of men is normally distributed with mean (µ) = 72.5 inches…
Q: A soft drink machine outputs a made of 28 ounces per cup. The machines output is normally…
A: Consider that the mean and standard deviation of a random variable X are µ and σ, respectively.…
Q: Which of the following statements is one of the advantages of simple random sampling method? Always…
A: One of the main advantages of simple random sampling method is it is always feasible in practice.
Q: Samples of size n = 9 are selected from a normal population with µ = 80 with σ = 18. What is the…
A: Solution
Q: Sample 1 n1 = 20 x₁ = = 22.7 S₁ = 2.6 $1 Sample 2 72 = 30 x₂ = 20.1 $₂ = 4.4
A: Given,For sample 1 :sample size (n1) =20sample mean (x̄1) = 22.7sample standard deviation (s1) =…
Q: The number of seconds X after the minute that class ends is uniformly distributed between 0 and 60.…
A:
Q: A bolt manufacturer makes a type of bolt to be used in airtight containers. The manufacturer claims…
A:
Q: A company selling a new econometrics software advertises it with the following slogan: “students…
A: Given: n = 12 α = 0.05 Formula Used: Test-statistic t = X-μsn
Q: You may need to use the appropriate appendix table or technology to answer this question. Consider…
A:
Q: Determine whether the underlined number is a statistic or a parameter. in a study of all 4622…
A:
Q: 1. a. Two fair dice are rolled at once. Let X denote the difference in the number of dots that…
A: A discrete random variable is a variable whose values can be obtained by counting. Though, the…
Q: raw the trend line, if there is, for each scatterplot. b. C. P etermine the strength of the value of…
A: For the given values of correlation coefficient, We have to tell strength of correlation. + shows (…
Q: 3. Classify the followi b. Number of credit h
A: Statement: The number of credit hours taken by a student this semester is discrete data.
Q: analysis of the sample data revealed that the hippocampal volume is approximately normal with no…
A: Given data : sample size, n =24 sample mean, x̄ = 8.04 sample standard…
Q: d. What is the probability that the random variable X is less than 15? (Round your answer to 2…
A: From Given Probability Distribution if xi is such that Pi≥0 where i=1,2,3...n Then ∑Pi=1…
Q: olve the following problems. Write your answer on your answer 1. You want to estimate the mean…
A: 1)The margin of error is 6 Standard deviation for gas price in the area is 24 centavos;σ=24 At 90%…
Q: d. The standard deviation is c. The mean of this distribution is probability that the time will be…
A: Given X~U(3,38) Result: if X~U(a,b) Mean=E(X)=(a+b)/2 V(X)=(b-a)2/12 Note: According to Bartleby…
Q: Approximate the sample mean for the following frequency distribution. Data Frequency 35-38 1 39-42 3…
A: Data Frequency (f) mid-values (x) f.x 35-38 1 36.5 36.5 39-42 3 40.5 121.5 43-46 4 44.5…
Q: Match the following descriptive statistic measures with the functions used in R to calculate them.…
A: The objective is to match the following descriptive statistic measures with the functions used in R…
Q: 4. The specification of the melting point of an alloy is 1200 degrees Celsius. If the melting point…
A: Formula : Test statistic
Q: in 3 three-credit classes in 1 four-credit class Din 1 three-credit class C in 1 four-credit class
A: Given A student receives the following grades, with an A worth 4 points, B worth 3 points, C worth…
Q: Suppose Z follows the standard normal distribution. Use the calculator provided, or this table, to…
A: Given,P(c≤Z≤-1.110)=0.1021
Q: A researcher wants to know whether identical twins differ in their self-confidence. Specifically,…
A: Correlated samples t test or matched pairs t test: The paired t is used when the two sample are…
Q: 1. Construct a 90% confidence interval for the proportion of employees requiring size 3.
A: here given A civil engineering firm issues every new employee with a safety helmet. Four different…
Q: Direction: Calculate Spearman's coefficient of rank correlation for the following. Describe the…
A: The objective is to calculate the Spearman's rank correlation coefficient and interpret it.
Q: Suppose you are a dolphin trainer at SeaWorld. You teach the dolphins by rewarding them with fish…
A: The answer is attached below,
Q: Could you explain how to go about #3 with a calculator?
A: Given: n = 6 d¯=-1sd=2.19Confidence level = 0.99
Q: Suppoose the p-value for a hypothesis is 0.0305. Using a 0.05, what is the appropriate conclusion?…
A:
Q: Use Equations (3.5) and (3.6) to estimate the coefficients of the line y = ax + b such that the sum…
A: Note: Hi, thank you for the question. As per our company guideline we are supposed to answer only…
Q: Test the hypothesis using the P-value approach. Be sure to verify the requirements of the test. Ho:…
A:
Q: 1. A company manufactures LCD monitors, which have a lifespan that is approximately normally…
A: As per our guidelines we are suppose to answer only one question1)GivenMean(x)=180standard…
Q: 1. A company manufactures LCD monitors, which have a lifespan that is approximately normally…
A: The provided information is x¯=180σ=96n=21α=0.05The critical value is zc=1.96 (from statistical…
Q: The Department of Transportation reports that out of all fatal crashes, 6% of the drivers were…
A: Given,n=345x=25p^=xnp^=25345=0.0725α=0.05
Q: There are three car mechanics have been hired in Ahmad Workshop. Each has different expertise that…
A: The following solution is provided below:
Q: 1. a. Two fair dice are rolled at once. Let X denote the difference in the number of dots that…
A: A discrete random variable is a variable whose values can be obtained by counting. Though, the…
Q: The records of a light bulb manufacturer show that, when the manufacturing machinery is working…
A: GivenThe defective rate is 1%i.e.,p=0.01sample size(n)=4400
Q: From a recent census, we obtain the following decomposition of the Australian population according…
A: From the provided information, The proportion of individuals who hold a postgraduate (Master and/or…
Q: A survey of a 117 randomly selected students at 1 college show that 90 check their campus email…
A:
Q: In 2008, a highway safety administration reported that the number of pedestrian fatalities in City A…
A:

Step by step
Solved in 2 steps

- A quality control manager has concerns about the occurrence of defects on acomponent assembly used in the fabrication of an aircraft wing. The manufacturing plantoperates with three shifts, and three particular types of defects are of concern. The followingtable shows the count of defects of each type across the shifts from a random sample of 300assemblies with defects from a week of production.Test whether the types of defects are independent of the shifts. Perform the test on the 5%level. What is your conclusion?A quality control manager has concerns about the occurrence of defects on acomponent assembly used in the fabrication of an aircraft wing. The manufacturing plantoperates with three shifts, and three particular types of defects are of concern. The followingtable shows the count of defects of each type across the shifts from a random sample of 300assemblies with defects from a week of production. Test whether the types of defects are independent of the shifts. Perform the test on the 5%level. What is your conclusion?A milk processing company test implemented a plant-wide energy conservation program with a goal of reducing the mean daily consumption rate of at least 1,000 kWh from its normal operating plants. The conservation program was implemented in Plant B. The following data was collected on weekdays where consumption level is at its peak. Were the conservation efforts effective in achieving its goal? Compare the results with Plant A’s data where the program is not implemented using α= 0.05. Assume that the population variances are not equal.
- A milk processing company test implemented a plant-wide energy conservation program with a goal of reducing the mean daily consumption rate of at least 1,000 kWh from its normal operating plants. The conservation program was implemented in Plant B. The following data was collected on weekdays where consumption level is at its peak. Were the conservation efforts effective in achieving its goal? Compare the results with Plant A’s data where the program is not implemented using � = 0.05. Assume that the population variances are not equal.Plant A (kWh) Plant B (kWh)3,952.80 4,036.003,276.00 4,036.003,636.00 4,036.003,636.00 3,264.003,636.00 864.003,636.00 1,368.004,068.00 2,196.004,068.00 4,392.004,362.00 5,220.004,362.00 3,600.004,362.00 3,960.004,362.00 4,428.003,882.00 756.003,808.80 612.003,808.80 684.00Consider an automatic production line that delivers computer components for inspection. According to the system’s specification, the interarrival time of the delivery follows a continuous uniform distribution between 5 to 15 minutes. The average inspection time of one component is 10 minutes. A simulation model was developed to replicate the system and eight samples were collected with the following data: Sample # 1 2 3 4 5 6 7 8 Interarrival time 14.7 14.8 6.8 11.6 6.3 13.3 7.9 10.3 Inspection time 8.3 5.7 4.0 9.0 10.6 5.9 8.5 7.0 Apply the Kolmogorov-Smirnov test, at the 1% level of significance, to test the hypothesis that the simulated interarrival times comply with the system’s specification. Conduct a statistical test to determine if the simulated inspection times are consistent with the system behavior at the 5% level of significance. Give another set of inspection times, 9.1, 12.7, 8.7, 10.8, 11.6, and 6.8,…The quality control department of a fabric finishing plant is studying the effect of several factors on the dyeing of cotton-synthetic cloth used to manufacture men’s shirts. Two operators, two cycle times and two temperatures were selected and three small specimen of cloth were dyed under each set of conditions. The scores of each fabric are given below. Derive the expected mean squares and test statistics to test for the interaction and main effects.
- The control limits for a 3-sigma c chart with n=2 when the process average is equal to 8 nonconformities for one inspection unit are Select one: a. LCL=0 UCL=16.5 b. LCL=-0.5 UCL=16.5 c. LCL=4 UCL=28 d. LCL=0 UCL=28 e. LCL=-4 UCL=281. An experiment was installed to test 4 rates of Zn on cabbage. The experiment was laid out in arandomized complete block design with 3 replicates. The yields are given in the table below. Treatment kg Zn/ha Block I II III 0 3.5 3.8 3.7 5 3.9 4.2 4.4 10 4 4.4 4.8 15 4.3 4.2 4.9 a) Calculate the analysis of variance manually for this data set and perform the appropriate Ftests. State the relevant hypotheses in terms of the parameters under test. Show allsolutions. Interpret the results of the tests in the context of the problem.b) Plot the treatment means with treatments at the x-axis. Describe the relationship.c) Calculate the relative efficiency of the RCBD over CRD. Interpret the results. How manyreplications should a CRD experiment have to be as efficient as the…The nation of Waipo has recently created an eco- nomic development plan that includes expanded exports and imports. It has completed a series of ex- tensive studies of the world economy and Waipo’s economic capability, following Waipo’s extensive 10-year educational-enhancement program. The re- sulting model indicates that in the next year exports will be normally distributed with a mean of 100 and a variance of 900 (in billions of Waipo yuan). In addi- tion, imports are expected to be normally distributed with a mean of 105 and a variance of 625 in the same units. The correlation between exports and imports is expected to be +0.70. Define the trade balance as ex- ports minus imports. Determine the mean and variance of the trade balance (exports minus imports) if the model parameters given above are true. What is the probability that the trade balance will be positive?
- The following graphs are the results of the Statistical Process Control (SPC). Are they classified as in-control or not?NutritionResearchers compared protein intake among threegroups of postmenopausal women: (1) women eating astandard American diet (STD), (2) women eating a lactoovo-vegetarian diet (LAC), and (3) women eating a strictvegetarian diet (VEG). The mean ± 1 sd for protein intake(mg) is presented in Table 12.29. *12.1 Perform a statistical procedure to comparethe means of the three groups using the critical-valuemethod.*12.2 What is the p-value from the test performed inProblem 12.1? I just want 12.2 solved.1. I am interested in determining if my revolutionary strength training program is effective. I randomly select 20 students from my SCM 200 class. I randomly place 10 into a control group (conventional strength training program) and 10 into the experimental group (the revolutionary accelerated hypertrophy/strength program). I measure them before and after the program on their 1R.M for bench press and want to determine if the change in lbs is significantly greater in the experimental group compared to the control group. Results were found to be 10lbs (mean change) for the control and 20lbs (mean change) for the experimental. Standard deviations for the control and experimental were found to be 3.5 and 2.5 respectively. Can I make the claim that my program appears to be effective at increasing strength? Using a TI 83 calculator


