The quality-control manager at a compact fluorescont light bulb (CFL) factory needs to determine whether the mean life of a large shipment of CFLS is equal to 747 hours The population standard deviation is 1,120 hours A random sample of 64 light bulbs indicates a sample mean life of 7,162 hours a. Al the 0.05 level of significance, is there evidence that the mean lide is different from 7470 hours? b. Compute the p-value and interpret its meaning c. Construct a 95% confidence interval estimate of the population mean ide of the ight bulbs
The quality-control manager at a compact fluorescont light bulb (CFL) factory needs to determine whether the mean life of a large shipment of CFLS is equal to 747 hours The population standard deviation is 1,120 hours A random sample of 64 light bulbs indicates a sample mean life of 7,162 hours a. Al the 0.05 level of significance, is there evidence that the mean lide is different from 7470 hours? b. Compute the p-value and interpret its meaning c. Construct a 95% confidence interval estimate of the population mean ide of the ight bulbs

MATLAB: An Introduction with Applications
6th Edition
ISBN:9781119256830
Author:Amos Gilat
Publisher:Amos Gilat
Chapter1: Starting With Matlab
Section: Chapter Questions
Problem 1P

Related questions
Question
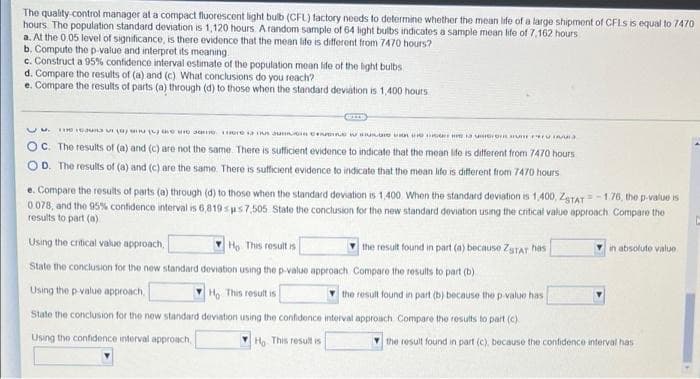
Transcribed Image Text:The quality-control manager at a compact fluorescont light bulb (CFL) factory needs to determine whether the mean life of a large shipment of CFLS is equal to 7470
hours The population standard deviation is 1,120 hours A random sample of 64 light bulbs indicates a sample mean life of 7,162 hours
a. At the 0.05 level of significance, is there evidence that the mean life is different from 7470 hours?
b. Compute the p-value and interpret its meaning.
c. Construct a 95% confidence interval estimate of the population mean lide of the bight bulbs
d. Compare the results of (a) and (c) What conclusions do you reach?
e. Compare the results of parts (a) through (d) to those when the standard deviation is 1,400 hours
CU aua aj u e e ae e a aunn nn wRune e H a uore U Uura
OC. The results of (a) and (c) are not the same. There is sufficient evidence to indicate that the mean ife is different from 7470 hours
OD. The results of (a) and (c) are the same There is sufficient evidence to indicate that the mean life is different from 7470 hours
e. Compare the results of parts (a) through (d) to those when the standard deviation is 1,400 When the standard deviation is 1,400, ZeTAT-176, the p-value is
0 078, and the 95% confidence interval is 6,819 sus7,505 State the conclusion for the new standard deviation using the cntical value approach Compare the
results to part (a)
Using the critical value approach,
Ho This result is
V the result found in part (a) because Z9TAT has
in absolute value
State the conclusion for the new standard deviation using the p-value approach Compare the results to part (b)
Using the p value approach,
V Họ This result is
the result found in part (b) because the p value has
State the conclusion for the new standard deviation using the confidence interval approach Compare the results to part (c)
Using the confidence interval approach,
V Ho This result is
V the result found in part (c), because the confidence interval has
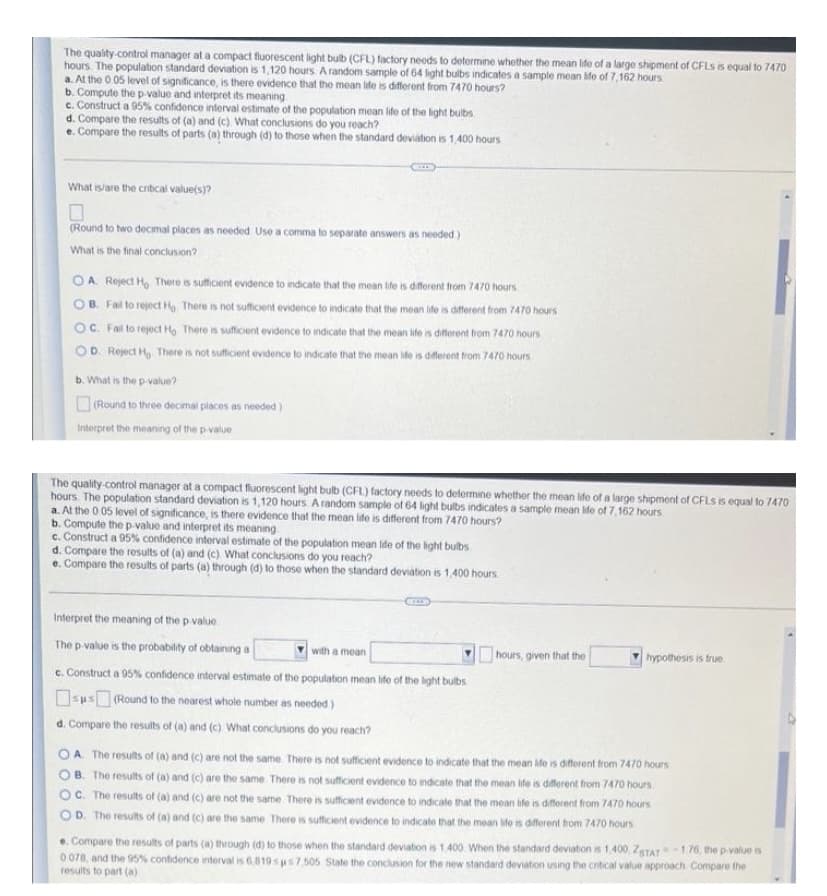
Transcribed Image Text:The quality-control manager at a compact fluorescent light bulb (CFL) factory neods to determine whether the mean life of a large shipment of CFLS is equal to 7470
hours. The population standard deviation is 1,120 hours A random sample of 64 light bulbs indicates a sample mean Me of 7,162 hours
a. At the 0 05 level of significance, is there evidence that the mean ife is different from 7470 hours?
b. Compute the p-value and interpret its meaning
c. Construct a 95% confidence interval estiımate of the population mean life of the light buibs
d. Compare the results of (a) and (c) What conclusions do you reach?
e. Compare the results of parts (a) through (d) to those when the standard deviation is 1,400 hours
What is/are the critical value(s)?
(Round to two decimal places as needed Use a comma to separate answers as needed )
What is the final conclusion?
OA Reject H, There is suficient evidence to ndicate that the mean ife is difforent from 7470 hours
OB. Fail to reject H, There is not sufticient evidence to indicate that the mean ife is different trom 7470 hours
OC. Fail to rejoct H There is sufficient evidence to indicate that the mean ife is diferent from 7470 hours
OD. Reject H, There is not suffcient evidence to indicate that the mean ide is diferent from 7470 hours
b. What is the p-value?
O(Round to three decimal places as needed )
Interpret the meaning of the p-value
The quality-control manager at a compact fluorescent light bulb (CFL) factory needs to determine whether the mean ife of a large shipment of CFLS is equal to 7470
hours. The population standard deviation is 1,120 hours Arandom sample of 64 light bulbs indicates a sample mean ife of 7,162 hours
a. Al the 0 05 level of significance, is there evidence that the mean life is different from 7470 hours?
b. Compute the p -value and interpret its meaning
c. Construct a 95% confidence interval estimate of the population mean life of the ight bulbs
d. Compare the results of (a) and (c) What conclusions do you reach?
e. Compare the results of parts (a) through (d) to those when the standard deviation is 1,400 hours
I5
Interpret the meaning of the p value.
The p-value is the probability of obtaining
with a mean
hours, given that the
hypothesis is true
e. Construct a 05% confidence interval estimate of the population mean Iife of the light bulbs
Osus (Round to the noarest whole number as needed)
d. Compare the results of (a) and (c) What conclusions do you reach?
OA The results of (0) and (c) are not the same. There is not sufficient evidence to indicate that the mean ife is different from 7470 hours
OB. The results of (a) and (c) are the same There is not sufficient evidence to indicate that the mean ife is different from 7470 hours
OC. The results of (a) and (c) are not the same There is sufficent evidence to indicate that the mean ife is diferent from 7470 hours
OD. The results of (0) and (c) are the same There is suficient evidence to indicate that the mean fe is diferent hom 7470 hours
. Compare the results of parts (a) through (d) to those when the standard deviation is 1.400 When the standard deviation is 1,400, ZgTAT-176, the p value is
0 078, and the 95% confidence interval is 6.819sus7.505 State the conclusion for the new standard deviation using the crtical value approach Compare the
results to part (a)
Expert Solution
This question has been solved!
Explore an expertly crafted, step-by-step solution for a thorough understanding of key concepts.

Step by step
Solved in 4 steps

Recommended textbooks for you
MATLAB: An Introduction with Applications
Statistics
ISBN:
9781119256830
Author:
Amos Gilat
Publisher:
John Wiley & Sons Inc

Probability and Statistics for Engineering and th…
Statistics
ISBN:
9781305251809
Author:
Jay L. Devore
Publisher:
Cengage Learning

Statistics for The Behavioral Sciences (MindTap C…
Statistics
ISBN:
9781305504912
Author:
Frederick J Gravetter, Larry B. Wallnau
Publisher:
Cengage Learning
MATLAB: An Introduction with Applications
Statistics
ISBN:
9781119256830
Author:
Amos Gilat
Publisher:
John Wiley & Sons Inc
Probability and Statistics for Engineering and th…
Statistics
ISBN:
9781305251809
Author:
Jay L. Devore
Publisher:
Cengage Learning
Statistics for The Behavioral Sciences (MindTap C…
Statistics
ISBN:
9781305504912
Author:
Frederick J Gravetter, Larry B. Wallnau
Publisher:
Cengage Learning

Elementary Statistics: Picturing the World (7th E…
Statistics
ISBN:
9780134683416
Author:
Ron Larson, Betsy Farber
Publisher:
PEARSON

The Basic Practice of Statistics
Statistics
ISBN:
9781319042578
Author:
David S. Moore, William I. Notz, Michael A. Fligner
Publisher:
W. H. Freeman

Introduction to the Practice of Statistics
Statistics
ISBN:
9781319013387
Author:
David S. Moore, George P. McCabe, Bruce A. Craig
Publisher:
W. H. Freeman