The regression equation is y =D (Round to one decimal place as needed.) Given that the systolic blood pressure in the right arm is|00mm Hg, the best predicted systolic blood pressure in the left arm is mm Hg. (Round to one decimal place as needed.) Data Table Critical Values of the Pearson Correlation Coefficient r NOTE: To test H p=0 against H, p= reject H, if the abs a=0.05 0.950 0 878 0.811 a= 0.01 0.990 0.959 0.917 6. ralue of r je greater
The regression equation is y =D (Round to one decimal place as needed.) Given that the systolic blood pressure in the right arm is|00mm Hg, the best predicted systolic blood pressure in the left arm is mm Hg. (Round to one decimal place as needed.) Data Table Critical Values of the Pearson Correlation Coefficient r NOTE: To test H p=0 against H, p= reject H, if the abs a=0.05 0.950 0 878 0.811 a= 0.01 0.990 0.959 0.917 6. ralue of r je greater

Chapter4: Linear Functions
Section: Chapter Questions
Problem 30PT: For the following exercises, use Table 4 which shows the percent of unemployed persons 25 years or...

Related questions
Question
8- Hi Great Bartleby Team, I need help with this stats exercise, it has 2 parts so please provide an answer for all the parts. Thanks in advance. (please pay attention to the image posted.
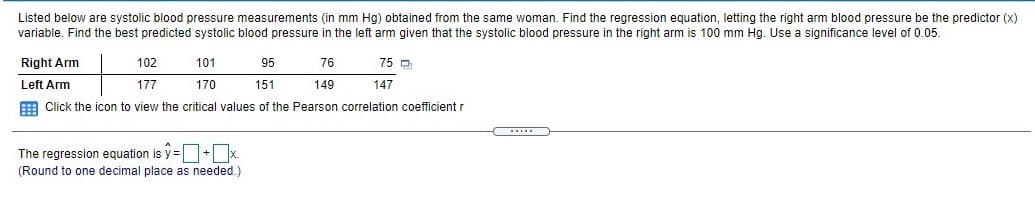
Transcribed Image Text:Listed below are systolic blood pressure measurements (in mm Hg) obtained from the same woman. Find the regression equation, letting the right arm blood pressure be the predictor (x)
variable. Find the best predicted systolic blood pressure in the left arm given that the systolic blood pressure in the right arm is 100 mm Hg. Use a significance level of 0.05.
Right Arm
102
101
95
76
75 D
Left Arm
177
170
151
149
147
E Click the icon to view the critical values of the Pearson correlation coefficient r
The regression equation is y =O+Ox.
(Round to one decimal place as needed.)
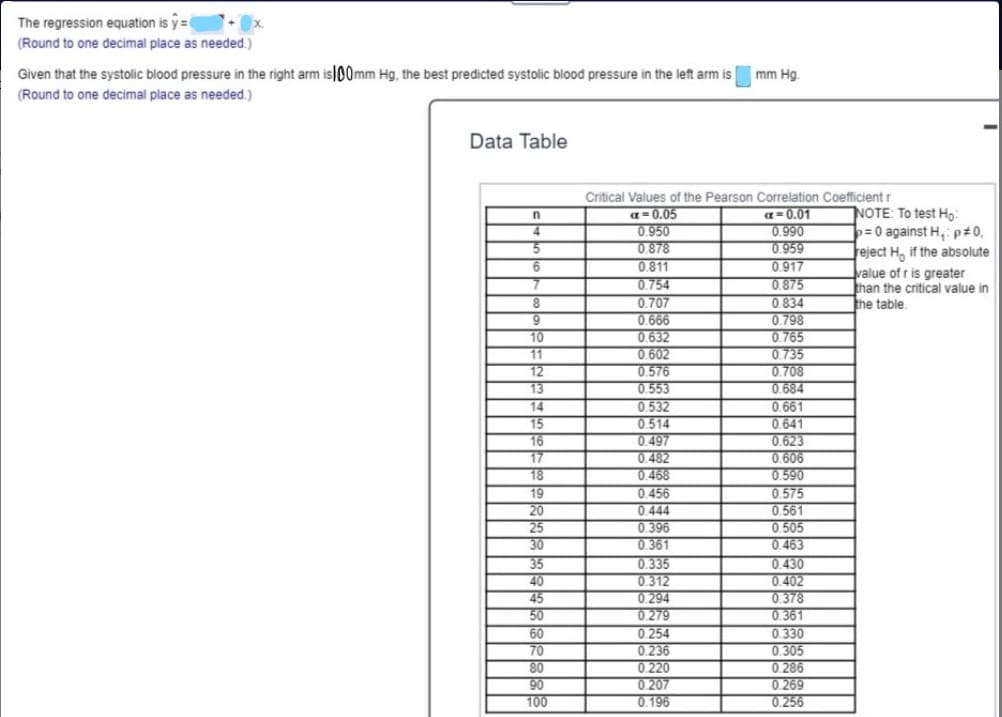
Transcribed Image Text:The regression equation is y =D
(Round to one decimal place as needed.)
Given that the systolic blood pressure in the right arm is|00mm Hg, the best predicted systolic blood pressure in the left arm is
mm Hg.
(Round to one decimal place as needed.)
Data Table
Critical Values of the Pearson Correlation Coefficientr
NOTE: To test Họ:
=0 against H, p#0,
reject H, if the absolute
value of r is greater
than the critical value in
the table.
a=0.05
0.950
0 878
0.811
0.754
0.707
0.666
0.632
0.602
0.576
0.553
0.532
0.514
0.497
0.482
a= 0.01
0.990
0.959
0.917
0875
0.834
0.798
0.765
0.735
0.708
4.
10
11
12
13
0.684
0.661
0.641
0.623
14
15
16
17
18
19
20
25
30
0.468
0.456
0.444
0.396
0.361
0.335
0.312
0294
0 279
0 254
0236
0.220
0 207
0.196
0.606
0.590
0.575
0.561
0.505
0.463
0.430
0.402
0.378
35
40
45
50
0.361
60
70
80
90
100
0.330
0.305
0.286
0.269
0.256
Expert Solution
This question has been solved!
Explore an expertly crafted, step-by-step solution for a thorough understanding of key concepts.

This is a popular solution!

Trending now
This is a popular solution!

Step by step
Solved in 3 steps with 2 images

Recommended textbooks for you

College Algebra
Algebra
ISBN:
9781305115545
Author:
James Stewart, Lothar Redlin, Saleem Watson
Publisher:
Cengage Learning

Glencoe Algebra 1, Student Edition, 9780079039897…
Algebra
ISBN:
9780079039897
Author:
Carter
Publisher:
McGraw Hill
College Algebra
Algebra
ISBN:
9781305115545
Author:
James Stewart, Lothar Redlin, Saleem Watson
Publisher:
Cengage Learning
Glencoe Algebra 1, Student Edition, 9780079039897…
Algebra
ISBN:
9780079039897
Author:
Carter
Publisher:
McGraw Hill

Algebra and Trigonometry (MindTap Course List)
Algebra
ISBN:
9781305071742
Author:
James Stewart, Lothar Redlin, Saleem Watson
Publisher:
Cengage Learning

Functions and Change: A Modeling Approach to Coll…
Algebra
ISBN:
9781337111348
Author:
Bruce Crauder, Benny Evans, Alan Noell
Publisher:
Cengage Learning