The regression equation is y=+x. (Round to one decimal place as needed.) Given that the systolic blood pressure in the right arm is '85 mm Hg, the best predicted systolic blood pressure in the left arm is mm Hg.
The regression equation is y=+x. (Round to one decimal place as needed.) Given that the systolic blood pressure in the right arm is '85 mm Hg, the best predicted systolic blood pressure in the left arm is mm Hg.

Glencoe Algebra 1, Student Edition, 9780079039897, 0079039898, 2018
18th Edition
ISBN:9780079039897
Author:Carter
Publisher:Carter
Chapter10: Statistics
Section10.3: Measures Of Spread
Problem 1GP

Related questions
Question
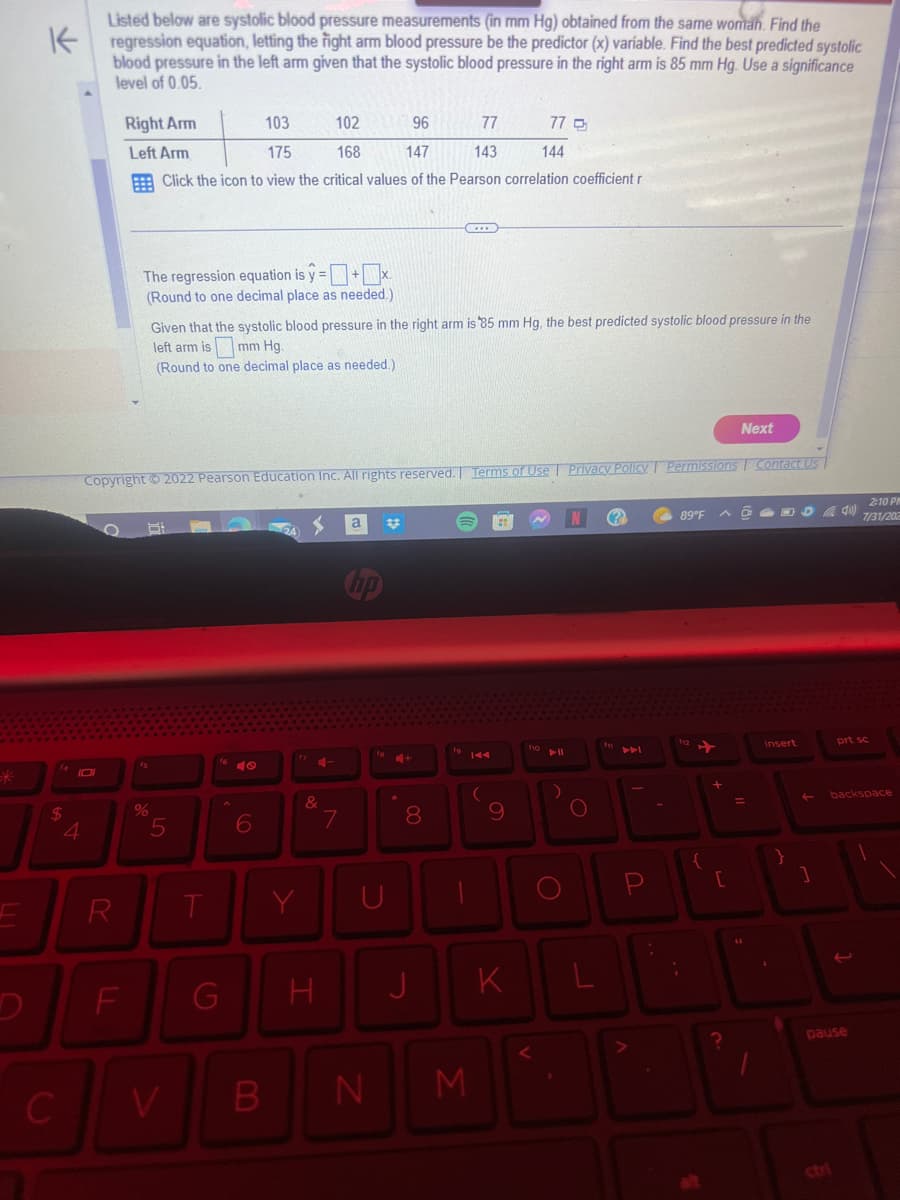
Transcribed Image Text:Listed below are systolic blood pressure measurements (in mm Hg) obtained from the same woman. Find the
Kregression equation, letting the right arm blood pressure be the predictor (x) variable. Find the best predicted systolic
blood pressure in the left arm given that the systolic blood pressure in the right arm is 85 mm Hg. Use a significance
level of 0.05.
$
C
4
R
Right Arm
103
102
96
77
Left Arm
175
168
147
143
Click the icon to view the critical values of the Pearson correlation coefficient r
F
The regression equation is y=+x.
(Round to one decimal place as needed.)
Di
%
Copyright © 2022 Pearson Education Inc. All rights reserved. Terms of Use | Privacy Policy Permissions Contact Us |
Given that the systolic blood pressure in the right arm is '85 mm Hg, the best predicted systolic blood pressure in the
left arm is
mm Hg.
(Round to one decimal place as needed.)
5
V
T
G
6
B
Y
4-
&
H
N
7
a
D
N
00
8
TE
J
19 144
3
H
9
K
77 O
V
144
10
)
O
N (?)
O
P
Next
89°F ADD40)
{
[
=
insert
}
2:10 PM
7/31/202
prt sc
backspace
pause
Expert Solution
This question has been solved!
Explore an expertly crafted, step-by-step solution for a thorough understanding of key concepts.

Step by step
Solved in 5 steps

Recommended textbooks for you
Glencoe Algebra 1, Student Edition, 9780079039897…
Algebra
ISBN:
9780079039897
Author:
Carter
Publisher:
McGraw Hill
Glencoe Algebra 1, Student Edition, 9780079039897…
Algebra
ISBN:
9780079039897
Author:
Carter
Publisher:
McGraw Hill