The results of the simple linear regression are provided below. Based on results below, interpret the p-value for testing whether B exceeds 0. * ŷ = -2,700 + 20x Sxy = 65, two – tailed p – value = 0.034 (for testing A %3D
The results of the simple linear regression are provided below. Based on results below, interpret the p-value for testing whether B exceeds 0. * ŷ = -2,700 + 20x Sxy = 65, two – tailed p – value = 0.034 (for testing A %3D

Trigonometry (MindTap Course List)
8th Edition
ISBN:9781305652224
Author:Charles P. McKeague, Mark D. Turner
Publisher:Charles P. McKeague, Mark D. Turner
Chapter4: Graphing And Inverse Functions
Section: Chapter Questions
Problem 6GP: If your graphing calculator is capable of computing a least-squares sinusoidal regression model, use...

Related questions
Question
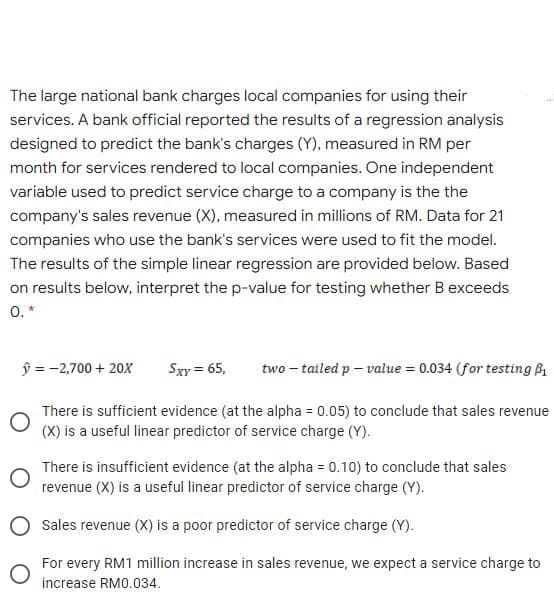
Transcribed Image Text:The large national bank charges local companies for using their
services. A bank official reported the results of a regression analysis
designed to predict the bank's charges (Y), measured in RM per
month for services rendered to local companies. One independent
variable used to predict service charge to a company is the the
company's sales revenue (X), measured in millions of RM. Data for 21
companies who use the bank's services were used to fit the model.
The results of the simple linear regression are provided below. Based
on results below, interpret the p-value for testing whether B exceeds
0. *
ŷ = -2,700 + 20X
Sxy = 65,
two – tailed p – value = 0.034 (for testing B1
There is sufficient evidence (at the alpha = 0.05) to conclude that sales revenue
(X) is a useful linear predictor of service charge (Y).
There is insufficient evidence (at the alpha = 0.10) to conclude that sales
revenue (X) is a useful linear predictor of service charge (Y).
O Sales revenue (X) is a poor predictor of service charge (Y).
For every RM1 million increase in sales revenue, we expect a service charge to
increase RM0.034.
Expert Solution
This question has been solved!
Explore an expertly crafted, step-by-step solution for a thorough understanding of key concepts.

This is a popular solution!

Trending now
This is a popular solution!

Step by step
Solved in 2 steps

Recommended textbooks for you
Trigonometry (MindTap Course List)
Trigonometry
ISBN:
9781305652224
Author:
Charles P. McKeague, Mark D. Turner
Publisher:
Cengage Learning
Trigonometry (MindTap Course List)
Trigonometry
ISBN:
9781305652224
Author:
Charles P. McKeague, Mark D. Turner
Publisher:
Cengage Learning