The scatterplot below shows the areas of some Galapagos Islands and the number of endemic species that exist on each island - use t to answer the questions that follow.


Unitary Method
The word “unitary” comes from the word “unit”, which means a single and complete entity. In this method, we find the value of a unit product from the given number of products, and then we solve for the other number of products.
Speed, Time, and Distance
Imagine you and 3 of your friends are planning to go to the playground at 6 in the evening. Your house is one mile away from the playground and one of your friends named Jim must start at 5 pm to reach the playground by walk. The other two friends are 3 miles away.
Profit and Loss
The amount earned or lost on the sale of one or more items is referred to as the profit or loss on that item.
Units and Measurements
Measurements and comparisons are the foundation of science and engineering. We, therefore, need rules that tell us how things are measured and compared. For these measurements and comparisons, we perform certain experiments, and we will need the experiments to set up the devices.
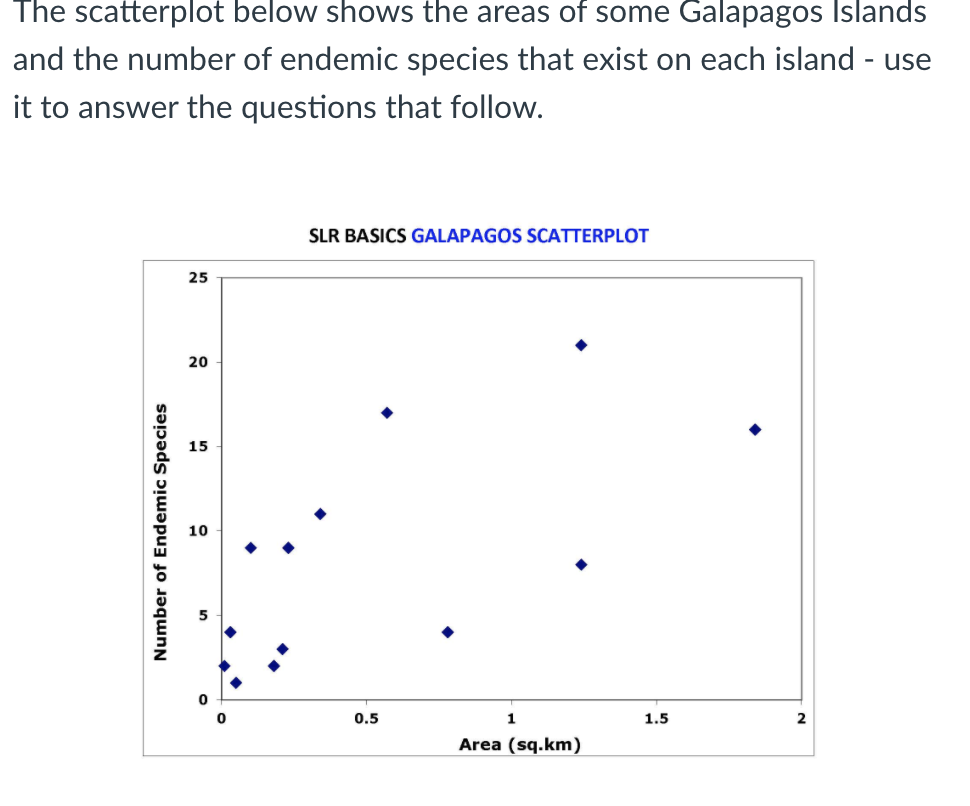
![(i) It seems that as area increases, the number of species
[ Select ]
. So the regression line, which is
not shown on the graph, would go bottom left to top right.
(ii) If we used the linear model to predict the number of endemic
species on an island whose area was 1.5 sq.km, then the predicted
number would be closest to [ Select ]
(ii) If R2 for the simple linear model was 43.9%, what was the
linear correlation coefficient for the data?
[ Select ]
(iv) None of the options here is the correct equation of the
regression line. However, your task here is to select the most likely
option. [ Select ]](/v2/_next/image?url=https%3A%2F%2Fcontent.bartleby.com%2Fqna-images%2Fquestion%2F67cd3f4f-dcc4-44d4-83f4-13332296f2a9%2F6741f02a-e25c-45a2-aca5-f23aa90f7c6f%2Fwd3hq4_processed.png&w=3840&q=75)


Trending now
This is a popular solution!

Step by step
Solved in 3 steps with 2 images


