The table below presents the production quantity, total revenue, and total cost of a company in its production process. Using the Excel program, you make a graph that represents the total income and total cost. Determines the level of economic gain or loss for each production level. Identifies the point where the gain is maximized. Identifies which of the four market structures studied this example belongs to. Explain your answer in a paragraph of at least five sentences. 田 Quantities in production Total income Total cost 27.23 1 36 55.69 2 72 81.68 3. 108 105.19 4 144 123.75 180 141.08 6. 216 155.93 252 174.49 8. 288 198.00 324 226.4e 6. 10 360 259.88 396 303.19 11 432 371.25 12 468 445.50 13 504 536.25 14 15 540 605.00
The table below presents the production quantity, total revenue, and total cost of a company in its production process. Using the Excel program, you make a graph that represents the total income and total cost. Determines the level of economic gain or loss for each production level. Identifies the point where the gain is maximized. Identifies which of the four market structures studied this example belongs to. Explain your answer in a paragraph of at least five sentences. 田 Quantities in production Total income Total cost 27.23 1 36 55.69 2 72 81.68 3. 108 105.19 4 144 123.75 180 141.08 6. 216 155.93 252 174.49 8. 288 198.00 324 226.4e 6. 10 360 259.88 396 303.19 11 432 371.25 12 468 445.50 13 504 536.25 14 15 540 605.00

Chapter16: Labor Markets
Section: Chapter Questions
Problem 16.5P

Related questions
Question
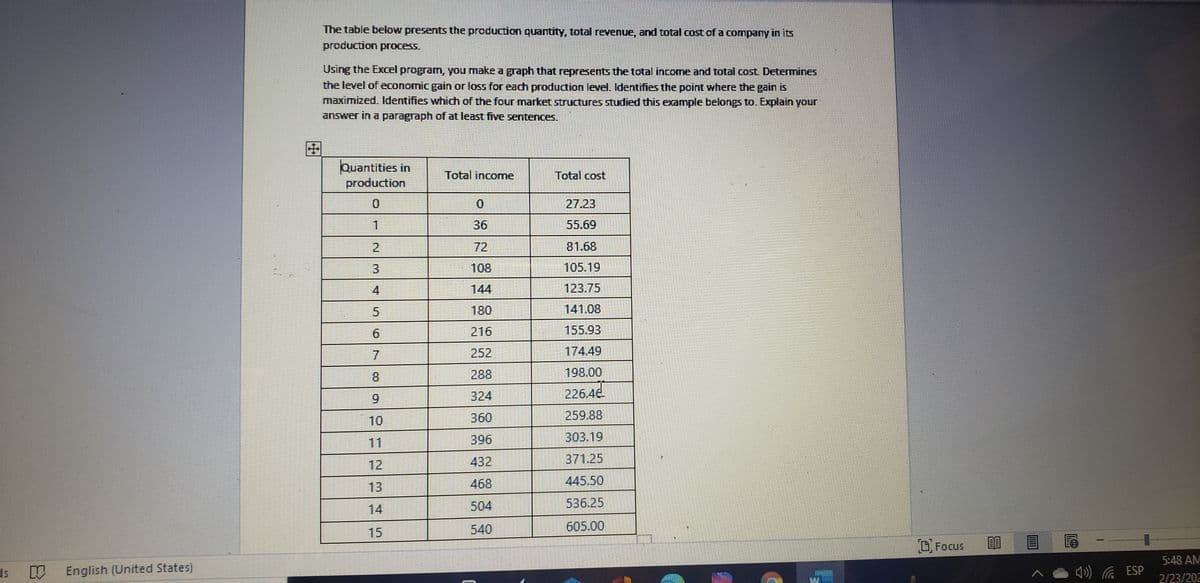
Transcribed Image Text:The table below presents the production quantity, total revenue, and total cost of a company in its
production process.
Using the Excel program, you make a graph that represents the total income and total cost. Determines
the level of economic gain or loss for eadch production level. Identifies the point where the gain is
maximized. Identifies which of the four market structures studied this example belongs to. Explain your
answer in a paragraph of at least five sentences.
Quantities in
production
Total income
Total cost
0.
0.
27.23
1
36
55.69
21
72
81.68
3.
108
105.19
144
123.75
180
141.08
216
155.93
252
174.49
8.
288
198.00
9.
324
226.48
10
360
259.88
396
303.19
11
12
432
371.25
13
468
445.50
504
536.25
14
15
540
605.00
OFocus
5:48 AM
ds
English (United States)
) G ESP
2/23/202
4.
5.
Expert Solution
Step 1
A firm produces to maximizes profit and profit is the difference between the total revenue and total cost.

Trending now
This is a popular solution!

Step by step
Solved in 4 steps with 1 images

Knowledge Booster


Learn more about
Need a deep-dive on the concept behind this application? Look no further. Learn more about this topic, economics and related others by exploring similar questions and additional content below.Recommended textbooks for you

Principles of Economics 2e
Economics
ISBN:
9781947172364
Author:
Steven A. Greenlaw; David Shapiro
Publisher:
OpenStax

Microeconomics: Private and Public Choice (MindTa…
Economics
ISBN:
9781305506893
Author:
James D. Gwartney, Richard L. Stroup, Russell S. Sobel, David A. Macpherson
Publisher:
Cengage Learning
Principles of Economics 2e
Economics
ISBN:
9781947172364
Author:
Steven A. Greenlaw; David Shapiro
Publisher:
OpenStax
Microeconomics: Private and Public Choice (MindTa…
Economics
ISBN:
9781305506893
Author:
James D. Gwartney, Richard L. Stroup, Russell S. Sobel, David A. Macpherson
Publisher:
Cengage Learning

Economics: Private and Public Choice (MindTap Cou…
Economics
ISBN:
9781305506725
Author:
James D. Gwartney, Richard L. Stroup, Russell S. Sobel, David A. Macpherson
Publisher:
Cengage Learning
