The table below shows the examination results of 100 students as a percentage Exam Result (%) Frequency 0-9 3 10-19 6 20-29 12 30-39 10 40-49 12 50-59 27 60-69 23 70-79 3 80-89 90-99 (i) the median value (ii) the inter-quartile range for the given data
The table below shows the examination results of 100 students as a percentage Exam Result (%) Frequency 0-9 3 10-19 6 20-29 12 30-39 10 40-49 12 50-59 27 60-69 23 70-79 3 80-89 90-99 (i) the median value (ii) the inter-quartile range for the given data

Glencoe Algebra 1, Student Edition, 9780079039897, 0079039898, 2018
18th Edition
ISBN:9780079039897
Author:Carter
Publisher:Carter
Chapter10: Statistics
Section10.3: Measures Of Spread
Problem 1GP

Related questions
Question
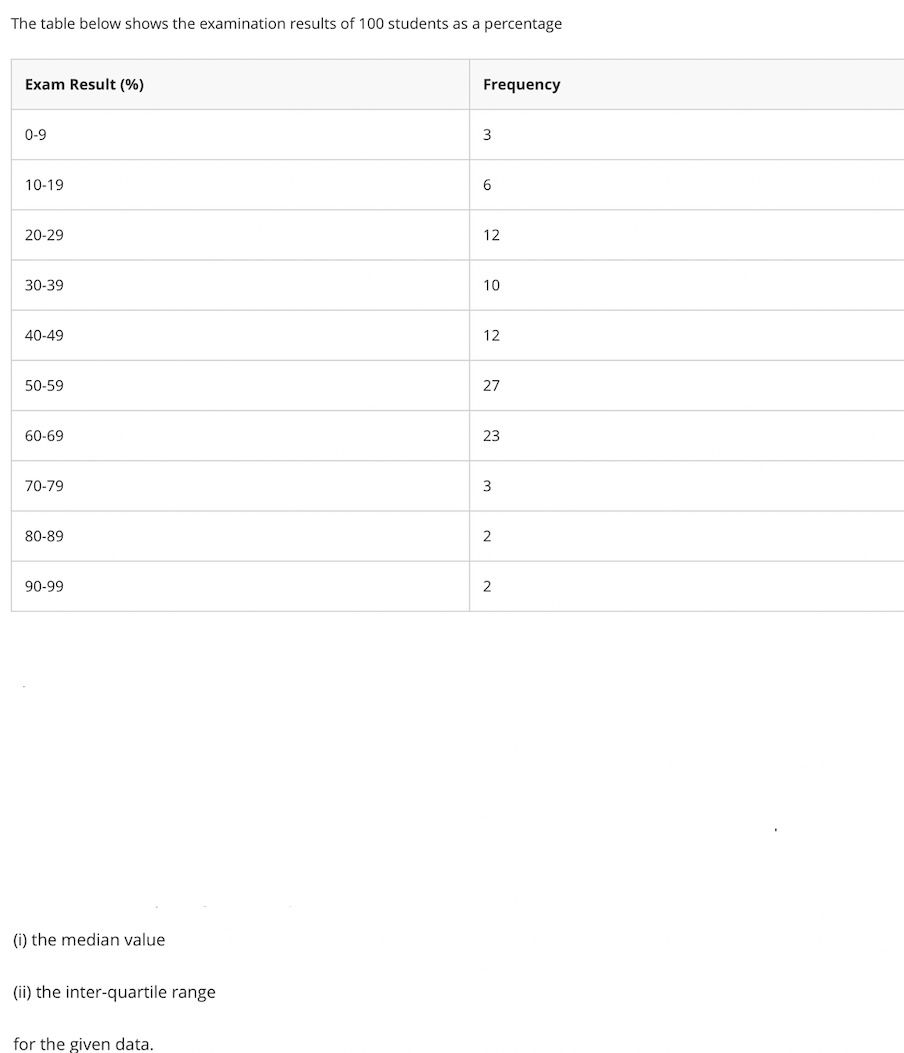
Transcribed Image Text:The table below shows the examination results of 100 students as a percentage
Exam Result (%)
Frequency
0-9
3
10-19
6
20-29
12
30-39
10
40-49
12
50-59
27
60-69
23
70-79
3
80-89
90-99
(i) the median value
(ii) the inter-quartile range
for the given data.
Expert Solution
This question has been solved!
Explore an expertly crafted, step-by-step solution for a thorough understanding of key concepts.

Step by step
Solved in 3 steps with 4 images

Recommended textbooks for you
Glencoe Algebra 1, Student Edition, 9780079039897…
Algebra
ISBN:
9780079039897
Author:
Carter
Publisher:
McGraw Hill

Big Ideas Math A Bridge To Success Algebra 1: Stu…
Algebra
ISBN:
9781680331141
Author:
HOUGHTON MIFFLIN HARCOURT
Publisher:
Houghton Mifflin Harcourt
Glencoe Algebra 1, Student Edition, 9780079039897…
Algebra
ISBN:
9780079039897
Author:
Carter
Publisher:
McGraw Hill
Big Ideas Math A Bridge To Success Algebra 1: Stu…
Algebra
ISBN:
9781680331141
Author:
HOUGHTON MIFFLIN HARCOURT
Publisher:
Houghton Mifflin Harcourt