This graph represents the results of the study. On the basis of the graph, what could you say about the performance of both groups of veterans relative to the healthy age-matched norms?
This graph represents the results of the study. On the basis of the graph, what could you say about the performance of both groups of veterans relative to the healthy age-matched norms?

Mathematics For Machine Technology
8th Edition
ISBN:9781337798310
Author:Peterson, John.
Publisher:Peterson, John.
Chapter87: An Introduction To G- And M-codes For Cnc Programming
Section: Chapter Questions
Problem 10A

Related questions
Question
6(4)
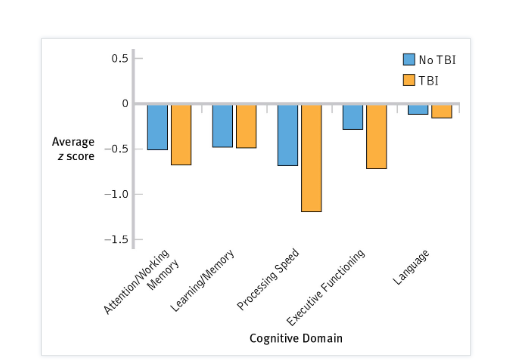
Transcribed Image Text:0.5
Average
-0.5
z score
No TBI
TBI
-1.0
-1.5
Memory
Learning/Memory
Processing Speed
Language
Cognitive Domain
Executive Functioning
Attention/Working
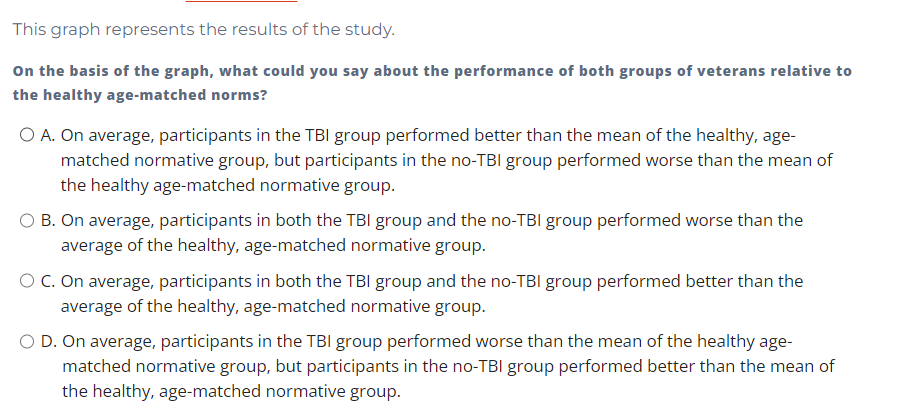
Transcribed Image Text:This graph represents the results of the study.
On the basis of the graph, what could you say about the performance of both groups of veterans relative to
the healthy age-matched norms?
O A. On average, participants in the TBI group performed better than the mean of the healthy, age-
matched normative group, but participants in the no-TBI group performed worse than the mean of
the healthy age-matched normative group.
O B. On average, participants in both the TBI group and the no-TBI group performed worse than the
average of the healthy, age-matched normative group.
O C. On average, participants in both the TBI group and the no-TBI group performed better than the
average of the healthy, age-matched normative group.
O D. On average, participants in the TBI group performed worse than the mean of the healthy age-
matched normative group, but participants in the no-TBI group performed better than the mean of
the healthy, age-matched normative group.
Expert Solution
This question has been solved!
Explore an expertly crafted, step-by-step solution for a thorough understanding of key concepts.

This is a popular solution!

Trending now
This is a popular solution!

Step by step
Solved in 2 steps

Recommended textbooks for you
Mathematics For Machine Technology
Advanced Math
ISBN:
9781337798310
Author:
Peterson, John.
Publisher:
Cengage Learning,
Mathematics For Machine Technology
Advanced Math
ISBN:
9781337798310
Author:
Peterson, John.
Publisher:
Cengage Learning,