The table below shows the frequency distribution of the weights (in grams) of pre-1964 quarters Choose the correct histogram below Weight (9) 6.000 6.049 6 050-6 099 6. 100-6.149 6.150-6.199 Frequency 15 4 11 12 63 We ) 6.200-6.249 6250-6 299 6 300-6349 6.350-6399 OB. Use the frequency distribution to construct a histogram. Does the histogram appear to depict data that have a normal distribution? Why or why not? 62 Weht ) 62 63 Weght ) Does the histogram appear to depict data that have a normal distribution? OA. The histogram does not appear to depict a normal distribution. The frequencies generally decrease to a minimum and then increase, and the histogram is roughly symmetric OB. The histogram appears to depict a normal distribution The frequencies generally increase to a maximum and then decrease, and the histogramm roughly symmetric OC. The histogram does not appear to depict a normal distribution. The frequencies generally increase and the histogram is roughly symmetric OD. The histogram appears to depict a normal distribution. The frequencies generally decrease to a minimum and then increase
The table below shows the frequency distribution of the weights (in grams) of pre-1964 quarters Choose the correct histogram below Weight (9) 6.000 6.049 6 050-6 099 6. 100-6.149 6.150-6.199 Frequency 15 4 11 12 63 We ) 6.200-6.249 6250-6 299 6 300-6349 6.350-6399 OB. Use the frequency distribution to construct a histogram. Does the histogram appear to depict data that have a normal distribution? Why or why not? 62 Weht ) 62 63 Weght ) Does the histogram appear to depict data that have a normal distribution? OA. The histogram does not appear to depict a normal distribution. The frequencies generally decrease to a minimum and then increase, and the histogram is roughly symmetric OB. The histogram appears to depict a normal distribution The frequencies generally increase to a maximum and then decrease, and the histogramm roughly symmetric OC. The histogram does not appear to depict a normal distribution. The frequencies generally increase and the histogram is roughly symmetric OD. The histogram appears to depict a normal distribution. The frequencies generally decrease to a minimum and then increase

Mathematics For Machine Technology
8th Edition
ISBN:9781337798310
Author:Peterson, John.
Publisher:Peterson, John.
Chapter29: Tolerance, Clearance, And Interference
Section: Chapter Questions
Problem 16A: Spacers are manufactured to the mean dimension and tolerance shown in Figure 29-12. An inspector...

Related questions

Concept explainers
Contingency Table
A contingency table can be defined as the visual representation of the relationship between two or more categorical variables that can be evaluated and registered. It is a categorical version of the scatterplot, which is used to investigate the linear relationship between two variables. A contingency table is indeed a type of frequency distribution table that displays two variables at the same time.
Binomial Distribution
Binomial is an algebraic expression of the sum or the difference of two terms. Before knowing about binomial distribution, we must know about the binomial theorem.
Topic Video
Question
11
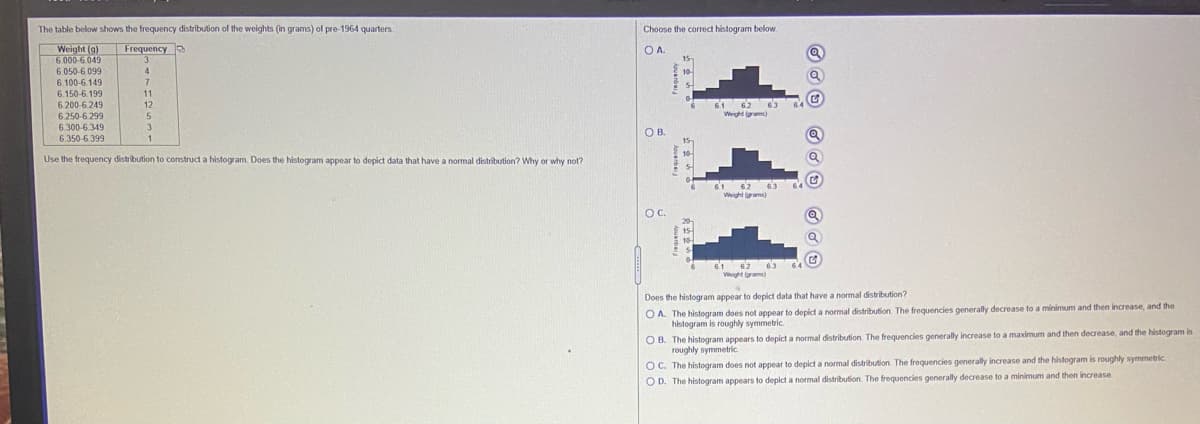
Transcribed Image Text:The table below shows the frequency distribution of the weights (in grams) of pre-1964 quarters.
Choose the correct histogram below
Frequency
Weight (g)
6.000-6.049
6.050-6 099
OA.
3
15
4
6.100-6.149
6.150-6.199
11
6.200-6.249
6.250-6.299
6.300-6.349
162 63
Weigh rm)
12
5
OB.
15
6.350-6.399
Use the frequency distribution to construct a histogram. Does the histogram appear to depict data that have a normal distribution? Why or why not?
6.1
Weight lgrams)
OC.
661 62 63
Weight )
Does the histogram appear to depict data that have a normal distribution?
O A. The histogram does not appear to depict a normal distribution. The frequencies generally decrease to a minimum and then increase, and the
histogram is roughly symmetric.
O B. The histogram appears to depict a normal distribution. The frequencies generally increase to a maximum and then decrease, and the histogram is
roughly symmetric.
OC. The histogram does not appear to depict a normal distribution. The frequencies generally increase and the histogram is roughly symmetric
O D. The histogram appears to depict a normal distribution. The frequencies generally decrease to a minimum and then increase
Expert Solution
This question has been solved!
Explore an expertly crafted, step-by-step solution for a thorough understanding of key concepts.

This is a popular solution!

Trending now
This is a popular solution!

Step by step
Solved in 2 steps

Knowledge Booster


Learn more about
Need a deep-dive on the concept behind this application? Look no further. Learn more about this topic, statistics and related others by exploring similar questions and additional content below.Recommended textbooks for you
Mathematics For Machine Technology
Advanced Math
ISBN:
9781337798310
Author:
Peterson, John.
Publisher:
Cengage Learning,

Glencoe Algebra 1, Student Edition, 9780079039897…
Algebra
ISBN:
9780079039897
Author:
Carter
Publisher:
McGraw Hill
Mathematics For Machine Technology
Advanced Math
ISBN:
9781337798310
Author:
Peterson, John.
Publisher:
Cengage Learning,
Glencoe Algebra 1, Student Edition, 9780079039897…
Algebra
ISBN:
9780079039897
Author:
Carter
Publisher:
McGraw Hill