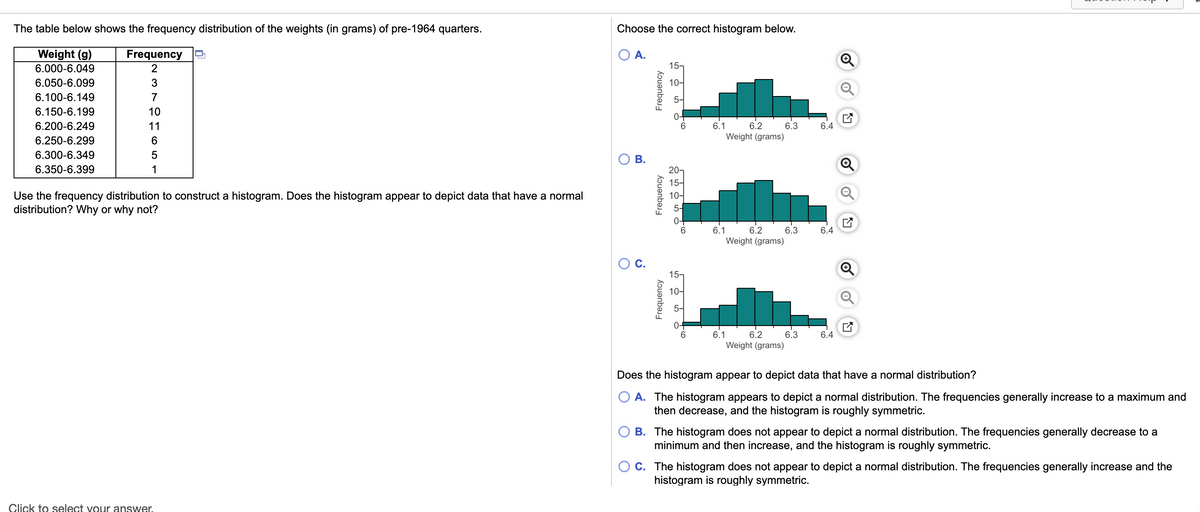
The table below shows the frequency distribution of the weights (in grams) of pre-1964 quarters. Choose the correct histogram below. Weight (g) Frequency 2 OA. 157 10- 6.000-6.049 6.050-6.099 3 6.100-6.149 6.150-6.199 10 6.1 6.3 Weight (grams) 6.200-6.249 11 6.2 6.250-6.299 6 6.300-6.349 5 OB. 6.350-6.399 1 15- 10- Q Use the frequency distribution to construct a histogram. Does the histogram appear to depict data that have a normal distribution? Why or why not? 04 6.3 6.1 6.2 Weight (grams) 6.4 Oc. 15 10어 6.1 62 Weight (grams) 6.3 6.4 Does the histogram appear to depict data that have a normal distribution? O A. The histogram appears to depict a normal distribution. The frequencies generally increase to a maximum and then decrease, and the histogram is roughly symmetric. O B. The histogram does not appear to depict a normal distribution. The frequencies generally decrease to a minimum and then increase, and the histogram is roughly symmetric. OC. The histogram does not appear to depict a normal distribution. The frequencies generally increase and the histogram is roughly symmetric.
The table below shows the frequency distribution of the weights (in grams) of pre-1964 quarters. Choose the correct histogram below. Weight (g) Frequency 2 OA. 157 10- 6.000-6.049 6.050-6.099 3 6.100-6.149 6.150-6.199 10 6.1 6.3 Weight (grams) 6.200-6.249 11 6.2 6.250-6.299 6 6.300-6.349 5 OB. 6.350-6.399 1 15- 10- Q Use the frequency distribution to construct a histogram. Does the histogram appear to depict data that have a normal distribution? Why or why not? 04 6.3 6.1 6.2 Weight (grams) 6.4 Oc. 15 10어 6.1 62 Weight (grams) 6.3 6.4 Does the histogram appear to depict data that have a normal distribution? O A. The histogram appears to depict a normal distribution. The frequencies generally increase to a maximum and then decrease, and the histogram is roughly symmetric. O B. The histogram does not appear to depict a normal distribution. The frequencies generally decrease to a minimum and then increase, and the histogram is roughly symmetric. OC. The histogram does not appear to depict a normal distribution. The frequencies generally increase and the histogram is roughly symmetric.

Glencoe Algebra 1, Student Edition, 9780079039897, 0079039898, 2018
18th Edition
ISBN:9780079039897
Author:Carter
Publisher:Carter
Chapter10: Statistics
Section10.4: Distributions Of Data
Problem 19PFA

Related questions
Question
Transcribed Image Text:The table below shows the frequency distribution of the weights (in grams) of pre-1964 quarters.
Choose the correct histogram below.
Weight (g)
Frequency
A.
6.000-6.049
2
15-
6.050-6.099
10-
6.100-6.149
7
6.150-6.199
10
6.200-6.249
11
6.1
6.2
6.3
6.4
6.250-6.299
Weight (grams)
6.300-6.349
6.350-6.399
1
20-
15-
10-
Use the frequen
distribution? Why or why not?
distribution to construct a histogram. Does the histogram appear to depict data that have a normal
6.
6.1
6.2
6.3
6.4
Weight (grams)
C.
15-
10-
6.1
6.2
6.3
6.4
Weight (grams)
Does the histogram appear to depict data that have a normal distribution?
A. The histogram appears to depict a normal distribution. The frequencies generally increase to a maximum and
then decrease, and the histogram is roughly symmetric.
B. The histogram does not appear to depict a normal distribution. The frequencies generally decrease to a
minimum and then increase, and the histogram is roughly symmetric.
C. The histogram does not appear to depict a normal distribution. The frequencies generally increase and the
histogram is roughly symmetric.
Click to select vour answer.
B.
Frequency
Frequency
Frequency
Expert Solution
This question has been solved!
Explore an expertly crafted, step-by-step solution for a thorough understanding of key concepts.

This is a popular solution!

Trending now
This is a popular solution!

Step by step
Solved in 2 steps

Knowledge Booster


Learn more about
Need a deep-dive on the concept behind this application? Look no further. Learn more about this topic, statistics and related others by exploring similar questions and additional content below.Recommended textbooks for you
Glencoe Algebra 1, Student Edition, 9780079039897…
Algebra
ISBN:
9780079039897
Author:
Carter
Publisher:
McGraw Hill

Mathematics For Machine Technology
Advanced Math
ISBN:
9781337798310
Author:
Peterson, John.
Publisher:
Cengage Learning,
Glencoe Algebra 1, Student Edition, 9780079039897…
Algebra
ISBN:
9780079039897
Author:
Carter
Publisher:
McGraw Hill
Mathematics For Machine Technology
Advanced Math
ISBN:
9781337798310
Author:
Peterson, John.
Publisher:
Cengage Learning,