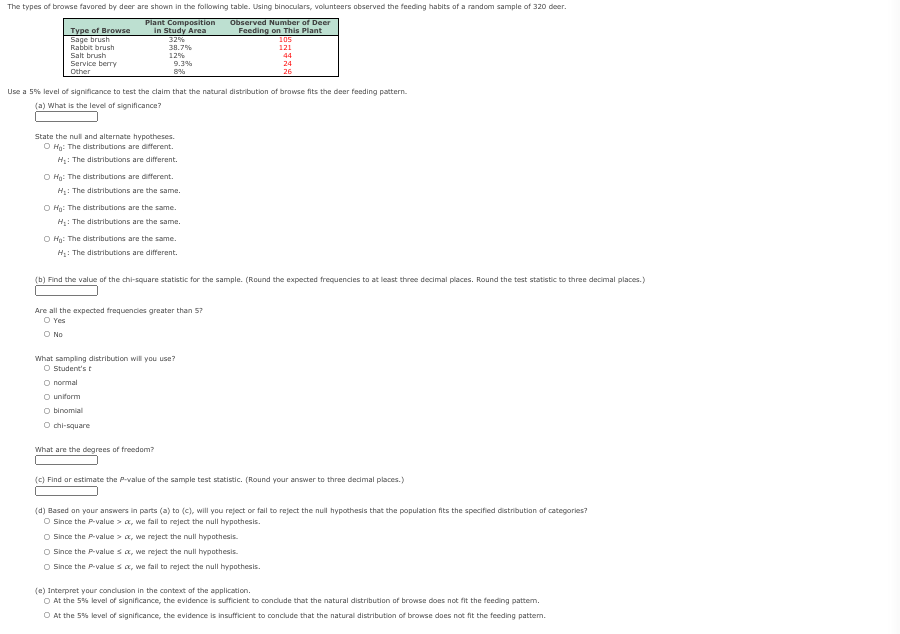
The types of browse favored by deer are shown in the following table. Using binoculars, volunteers observed the feeding habits of a random sample of 320 deer. Plant Composition in Study Area 32% Observed Number of Deer Feeding on This Plant Type of Browse Sage brush 105 Rabbit brush 38.7% 121 Salt brush Service berry 12% 9.3% 44 24 Other 8% 26 Use a 5% level of significance to test the claim that the natural distribution of browse fits the deer feeding pattern. (a) What is the level af significance? State the null and alternate hypotheses. O Hg: The distributions are different. H: The distributions are different. O Hg: The distributions are different. H: The distributions are the same. O Hg: The distributions are the same. H: The distributions are the same. O Hn: The distributions are the same. H: The distributions are different. (b) Find the value of the chi-square statistic for the sample. (Round the expected frequencies to at least three decimal places. Round the test statistic to three decimal places.) Are all the expected frequencies greater than 57 O Yes O No What sampling distribution will you use? O Student's t O normal O uniform O binomial O hi-square What are the degrees of freedom? (c) Find or estimate the P-value of the sample test statistic. (Round your answer to three decimal places.)
The types of browse favored by deer are shown in the following table. Using binoculars, volunteers observed the feeding habits of a random sample of 320 deer. Plant Composition in Study Area 32% Observed Number of Deer Feeding on This Plant Type of Browse Sage brush 105 Rabbit brush 38.7% 121 Salt brush Service berry 12% 9.3% 44 24 Other 8% 26 Use a 5% level of significance to test the claim that the natural distribution of browse fits the deer feeding pattern. (a) What is the level af significance? State the null and alternate hypotheses. O Hg: The distributions are different. H: The distributions are different. O Hg: The distributions are different. H: The distributions are the same. O Hg: The distributions are the same. H: The distributions are the same. O Hn: The distributions are the same. H: The distributions are different. (b) Find the value of the chi-square statistic for the sample. (Round the expected frequencies to at least three decimal places. Round the test statistic to three decimal places.) Are all the expected frequencies greater than 57 O Yes O No What sampling distribution will you use? O Student's t O normal O uniform O binomial O hi-square What are the degrees of freedom? (c) Find or estimate the P-value of the sample test statistic. (Round your answer to three decimal places.)

Glencoe Algebra 1, Student Edition, 9780079039897, 0079039898, 2018
18th Edition
ISBN:9780079039897
Author:Carter
Publisher:Carter
Chapter10: Statistics
Section10.6: Summarizing Categorical Data
Problem 10CYU

Related questions
Topic Video
Question
Transcribed Image Text:The types of browse favored by deer are shown in the following table. Using binoculars, volunteers observed the feeding habits of a random sample of 320 deer.
Plant Composition
in Study Area
32%
Observed Number of Deer
Feeding on This Plant
Type of Browse
Sage brush
105
Rabbit brush
38.7%
121
Salt brush
Service berry
12%
9.3%
44
24
Other
8%
26
Use a 5% level of significance to test the claim that the natural distribution of browse fits the deer feeding pattern.
(a) What is the level af significance?
State the null and alternate hypotheses.
O Hg: The distributions are different.
H: The distributions are different.
O Hg: The distributions are different.
H: The distributions are the same.
O Hg: The distributions are the same.
H: The distributions are the same.
O Hn: The distributions are the same.
H: The distributions are different.
(b) Find the value of the chi-square statistic for the sample. (Round the expected frequencies to at least three decimal places. Round the test statistic to three decimal places.)
Are all the expected frequencies greater than 57
O Yes
O No
What sampling distribution will you use?
O Student's t
O normal
O uniform
O binomial
O hi-square
What are the degrees of freedom?
(c) Find or estimate the P-value of the sample test statistic. (Round your answer to three decimal places.)
(d) Based on your answers in parts (a) to (c), will you reject or fail to reject the null hypothesis that the population fits the specified distribution of categories?
O Since the P-value > a, we fall to reject the null hypothesis.
O Since the P-value > a, we reject the null hypothesis.
O Since the P-value sa, we reject the null hypothesis.
O Since the P-value sa, we fall to reject the null hypothesis.
(e) Interpret your condusion in the context of the application.
O At the 5% level of significance, the evidence is sufficient to condlude that the natural distribution of browse does not fit the feeding pattem.
O At the 5% level of significance, the evidence is insufficient to conclude that the natural distribution of browse does not fit the feeding pattem.
Expert Solution
This question has been solved!
Explore an expertly crafted, step-by-step solution for a thorough understanding of key concepts.

This is a popular solution!

Trending now
This is a popular solution!

Step by step
Solved in 2 steps with 1 images

Knowledge Booster


Learn more about
Need a deep-dive on the concept behind this application? Look no further. Learn more about this topic, statistics and related others by exploring similar questions and additional content below.Recommended textbooks for you
Glencoe Algebra 1, Student Edition, 9780079039897…
Algebra
ISBN:
9780079039897
Author:
Carter
Publisher:
McGraw Hill
Glencoe Algebra 1, Student Edition, 9780079039897…
Algebra
ISBN:
9780079039897
Author:
Carter
Publisher:
McGraw Hill