their IQ score. STATISTICS IQ SCORE GRADE Rank Rank STUDENT Y Y D D 1 65 85 50 74 3 55 76 65 90 70 85 6. 65 87 70 94 55 85 70 90 10 50 81 11 55 91 12 75 76 13 80 74
their IQ score. STATISTICS IQ SCORE GRADE Rank Rank STUDENT Y Y D D 1 65 85 50 74 3 55 76 65 90 70 85 6. 65 87 70 94 55 85 70 90 10 50 81 11 55 91 12 75 76 13 80 74

Glencoe Algebra 1, Student Edition, 9780079039897, 0079039898, 2018
18th Edition
ISBN:9780079039897
Author:Carter
Publisher:Carter
Chapter10: Statistics
Section10.4: Distributions Of Data
Problem 19PFA

Related questions
Question
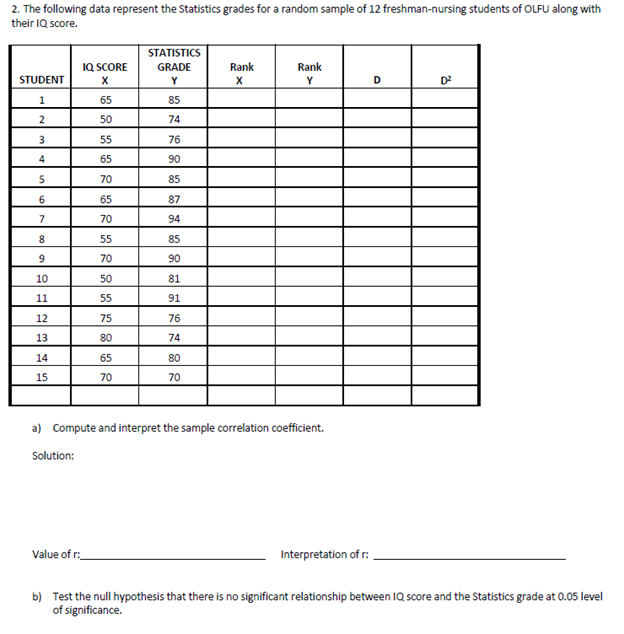
Transcribed Image Text:2. The following data represent the Statistics grades for a random sample of 12 freshman-nursing students of OLFU along with
their IQ score.
STATISTICS
IQ SCORE
GRADE
Rank
Rank
STUDENT
Y
Y
D
D2
1
65
85
50
74
3
55
76
4
65
90
70
85
6.
65
87
7
70
94
8.
55
85
9
70
90
10
50
81
11
55
91
12
75
76
13
80
74
14
65
80
15
70
70
a) Compute and interpret the sample correlation coefficient.
Solution:
Value of r:
Interpretation of r:
b) Test the null hypothesis that there is no significant relationship between 1Q score and the Statistics grade at 0.05 level
of significance.
Expert Solution
This question has been solved!
Explore an expertly crafted, step-by-step solution for a thorough understanding of key concepts.

Step by step
Solved in 3 steps with 3 images

Recommended textbooks for you
Glencoe Algebra 1, Student Edition, 9780079039897…
Algebra
ISBN:
9780079039897
Author:
Carter
Publisher:
McGraw Hill
Glencoe Algebra 1, Student Edition, 9780079039897…
Algebra
ISBN:
9780079039897
Author:
Carter
Publisher:
McGraw Hill