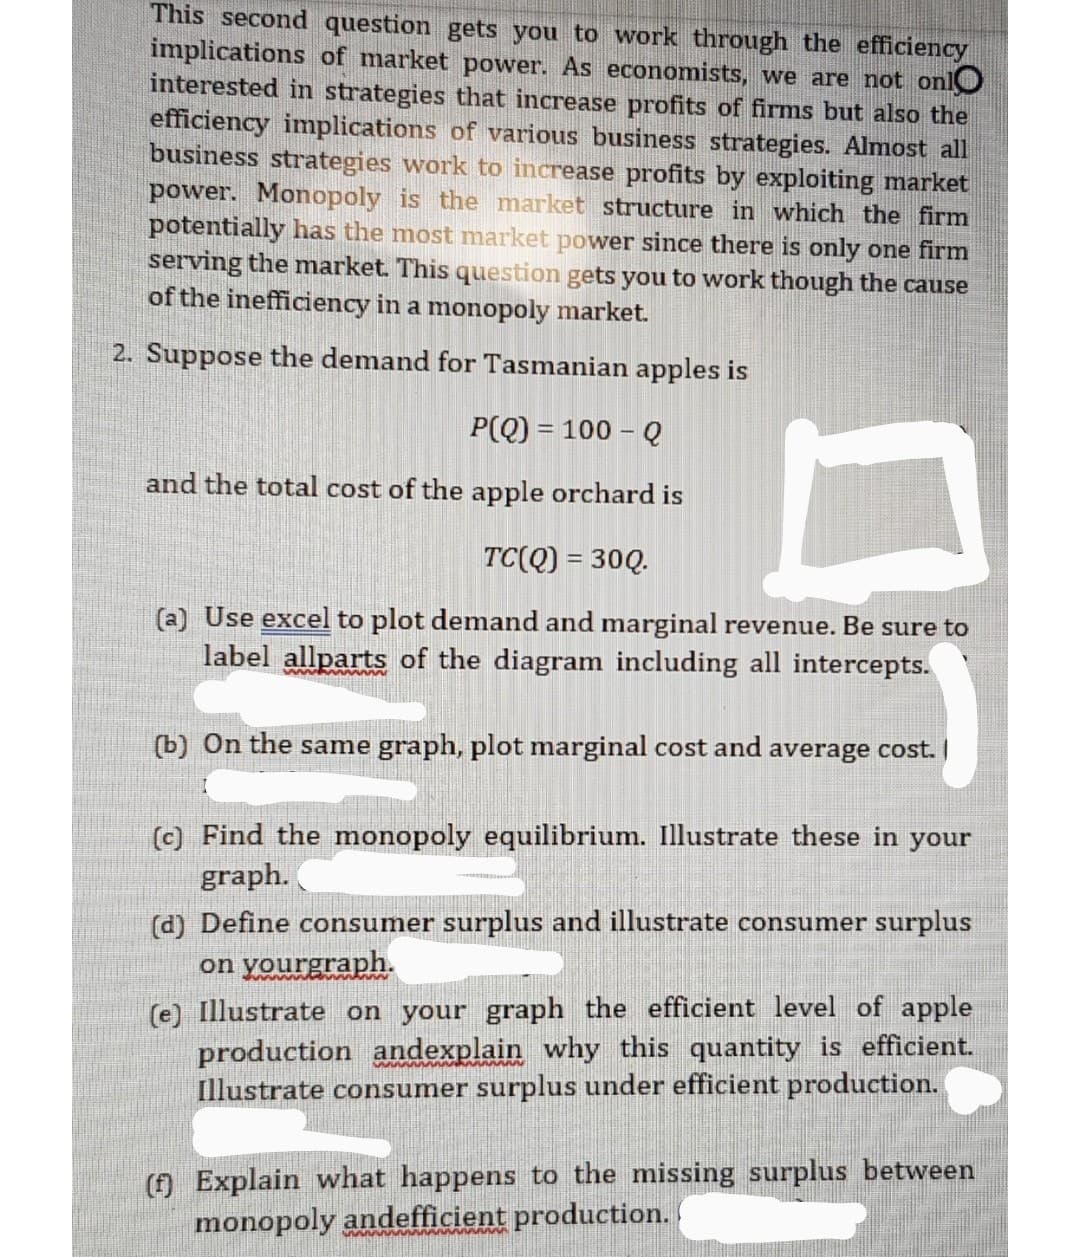
This second question gets you to work through the efficiency implications of market power. As economists, we are not onlO interested in strategies that increase profits of firms but also the efficiency implications of various business strategies. Almost all business strategies work to increase profits by exploiting market power. Monopoly is the market structure in which the firm potentially has the most market power since there is only one firm serving the market. This question gets you to work though the cause of the inefficiency in a monopoly market. 2. Suppose the demand for Tasmanian apples is P(Q) = 100 – Q and the total cost of the apple orchard is TC(Q) = 30Q. (a) Use excel to plot demand and marginal revenue. Be sure to label allparts of the diagram including all intercepts. (b) On the same graph, plot marginal cost and average cost. I (c) Find the monopoly equilibrium. Illustrate these in your graph. d) Define consumer surplus and illustrate consumer surplus on yourgraph. (e) Illustrate on your graph the efficient level of apple production andexplain why this quantity is efficient. Illustrate consumer surplus under efficient production. () Explain what happens to the missing surplus between monopoly andefficient production.
This second question gets you to work through the efficiency implications of market power. As economists, we are not onlO interested in strategies that increase profits of firms but also the efficiency implications of various business strategies. Almost all business strategies work to increase profits by exploiting market power. Monopoly is the market structure in which the firm potentially has the most market power since there is only one firm serving the market. This question gets you to work though the cause of the inefficiency in a monopoly market. 2. Suppose the demand for Tasmanian apples is P(Q) = 100 – Q and the total cost of the apple orchard is TC(Q) = 30Q. (a) Use excel to plot demand and marginal revenue. Be sure to label allparts of the diagram including all intercepts. (b) On the same graph, plot marginal cost and average cost. I (c) Find the monopoly equilibrium. Illustrate these in your graph. d) Define consumer surplus and illustrate consumer surplus on yourgraph. (e) Illustrate on your graph the efficient level of apple production andexplain why this quantity is efficient. Illustrate consumer surplus under efficient production. () Explain what happens to the missing surplus between monopoly andefficient production.

Managerial Economics: Applications, Strategies and Tactics (MindTap Course List)
14th Edition
ISBN:9781305506381
Author:James R. McGuigan, R. Charles Moyer, Frederick H.deB. Harris
Publisher:James R. McGuigan, R. Charles Moyer, Frederick H.deB. Harris
Chapter12: Price And Output Determination: Oligopoly
Section: Chapter Questions
Problem 1E

Related questions
Question
sub= 24 help
Transcribed Image Text:This second question gets you to work through the efficiency
implications of market power. As economists, we are not onlO
interested in strategies that increase profits of firms but also the
efficiency implications of various business strategies. Almost all
business strategies work to increase profits by exploiting market
power. Monopoly is the market structure in which the firm
potentially has the most market power since there is only one firm
serving the market. This question gets you to work though the cause
of the inefficiency in a monopoly market.
2. Suppose the demand for Tasmanian apples is
P(Q) = 100 – Q
and the total cost of the apple orchard is
TC(Q) = 30Q.
(a) Use excel to plot demand and marginal revenue. Be sure to
label allparts of the diagram including all intercepts.
(b) On the same graph, plot marginal cost and average cost. I
(c) Find the monopoly equilibrium. Illustrate these in your
graph.
(d) Define consumer surplus and illustrate consumer surplus
on yourgraph.
(e) Illustrate on your graph the efficient level of apple
production andexplain why this quantity is efficient.
Illustrate consumer surplus under efficient production.
() Explain what happens to the missing surplus between
monopoly andefficient production.
Expert Solution
This question has been solved!
Explore an expertly crafted, step-by-step solution for a thorough understanding of key concepts.

This is a popular solution!

Trending now
This is a popular solution!

Step by step
Solved in 3 steps with 3 images

Knowledge Booster


Learn more about
Need a deep-dive on the concept behind this application? Look no further. Learn more about this topic, economics and related others by exploring similar questions and additional content below.Recommended textbooks for you
Managerial Economics: Applications, Strategies an…
Economics
ISBN:
9781305506381
Author:
James R. McGuigan, R. Charles Moyer, Frederick H.deB. Harris
Publisher:
Cengage Learning

Principles of Economics 2e
Economics
ISBN:
9781947172364
Author:
Steven A. Greenlaw; David Shapiro
Publisher:
OpenStax
Managerial Economics: Applications, Strategies an…
Economics
ISBN:
9781305506381
Author:
James R. McGuigan, R. Charles Moyer, Frederick H.deB. Harris
Publisher:
Cengage Learning
Principles of Economics 2e
Economics
ISBN:
9781947172364
Author:
Steven A. Greenlaw; David Shapiro
Publisher:
OpenStax