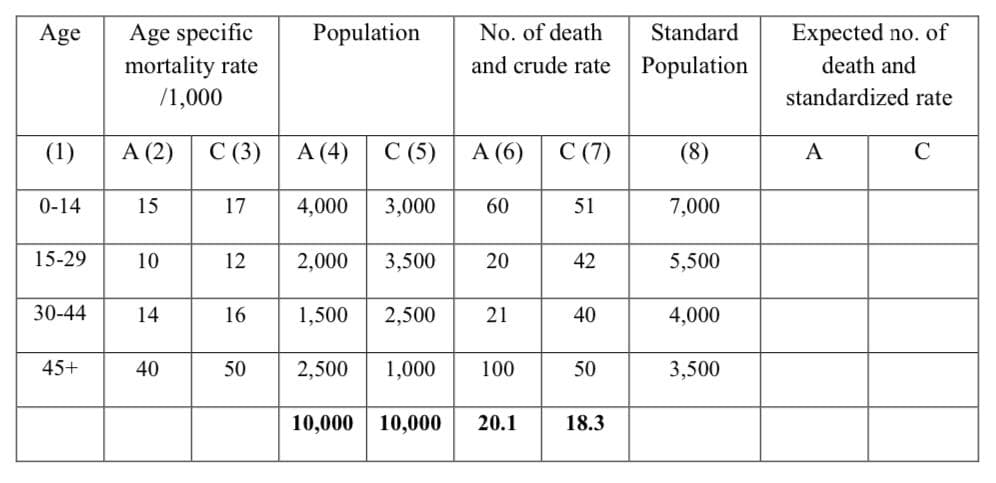
tical Age specific mortality data of A and C regi


Q: Table 2-2 Wafers Classified by Contamination and Location Number of Contamination Particles Center…
A: Given, A: event that a wafer contains 4 or more particles. B: event that a wafer is from centre of…
Q: Question 22 of 22 (1 point) Attempt 1 of 2 View question in a popup 7.6 Section Exercise 22 A…
A: We have to find Minimum Q1 Q2 Q3 Maximum.... For box plot...
Q: Question No: 01 Aalia 45 Y Ranbir 61 Deepika 52 F Y Shalini 56 Y Akshay 60 M a. Identify the type…
A: Mean is defined as the ratio of sum of all the observations and the total no. of observations.…
Q: 11. Please complete the table: Static Favorable OR Budget Actual Variance Unfavorab le. Units…
A: The answers to the blanks in the table above are as follows :
Q: Question 6 Points 1 Given the following contingency table for hair color and eye color of college…
A: We have given the data for the contingency table for hair color and eye color.
Q: Table 2. 5 shows the amount, in inches, of annual rainfall in a sample of towns. Table 2.5: Rainfall…
A: Frequency gives the number of elements in a given range for example if the range is 2-4 and elements…
Q: Problem 5. Infestation of crops by insects has long been of great concern to farmers and agri-…
A: 4) Given information: ∑x=213, ∑x2=4653, ∑y=479, ∑y2=26985, ∑x*y=10953n=11
Q: Refer to exhibit 1 below. What is the prediction equation for determining Heat BTU’s? a. Heat…
A: It is asked to find the prediction equation for determining Heat BTU’s. The regression equation that…
Q: TABLE 2.6 Snake River Data for Problem 2.7 Y Y 23.1 10.5 32.8 16.7 31.8 18.2 32.0 17.0 30.4 16.3…
A: Hi! Thank you for the question, As per the honor code, we are allowed to answer three sub-parts at a…
Q: PART 1: Define/ Laplain/Desa 1. Statistics 2 Statistic 3. Infarential Statistics
A: Statistics : Statistics is that the branch of arithmetic that deals with the gathering, organizing,…
Q: QUESTION 12 he time required to complete a particular assembly operation has a uniform distribution…
A: From the given information we find the probability using uniform distribution.
Q: Refer the data in images Problem a)What is the appropriate test procedure to test for significant…
A: Solution: It is required to test if there is significant differences in mean white blood cell count…
Q: Question 11. Healthcare workers are at risk of being exposed to blood-borne pathogens through…
A: To check the Paired test or unpaired test The Paired t-Test compares two means that are from the…
Q: Question 3 150 steel workshops have the following distribution of average number of workers in…
A:
Q: 1. Referring to the pollution data of Table 1: Table 1: Measures of Solids and Chemical Oxygen…
A: Use the given data to form regression table in excel: SUMMARY OUTPUT…
Q: For the following calculations, use the results in column (3) of Table 13.2.Consider two classrooms,…
A:
Q: A college is interested in if the year of receiving high-level education (college and above)…
A: In this case Year of high-level education (x) is the independent variable and Salary per week (y) is…
Q: Table 2.3. Absolute Frequency of Apis mellifera house bees across months Class Age Months (days)…
A: We have given absolute Frequency data : We have to calculate mean for every month and relative…
Q: Problem 5. Infestation of crops by insects has long been of great concern to farmers and agri-…
A: Since you have posted a question with multiple sub-parts, we will solve first three sub-parts for…
Q: Section 1-Question 13 Jennifer asked 50 students if they preferred dogs or cats. The table shows the…
A:
Q: Need answers to questions 1, 2, and 3.
A: 1. Excel is used to make the scatter plot for provided data of Autism Cases verses DTP Coverage. The…
Q: Obtain the appropriate measure of dispersion for age and both income variables. DATA Subject…
A: Standard deviation (SD) is the most commonly used measure of dispersion. It is a measure of spread…
Q: 4. In water-resources engineering, the sizing of reservoirs depends on accurate estimates of water…
A: Data ploting
Q: Prepare a table like the one given by using the same procedure (a) for the case in which you draw…
A: a) Given data: The given number of marbles is: 3. The below table shows the possible outcome…
Q: Table 2 Department Mean SD CoefVar Min Q1 Median Q3 Max IQR Skewness Finance 6.052…
A: Skewness: A frequency distribution of the set of values that is not symmetrical or normal is called…
Q: 2. A data set contains the following variables, each of which has been observed for 753 women.…
A:
Q: Question 2: An international private school called IWB has two branches in the GCC countries, one in…
A: Hi! Thank you for the question, As per the honor code, we are allowed to answer three sub-parts at a…
Q: Suppose that George wants to determine if the number of y insects in a given area is related to the…
A: Given:
Q: These pictures are from the same page. I need the answers to be both questions.
A: Scatterplot of y1 versus x1:Step-by-step procedure to plot scatterplot using EXCEL:Select the data…
Q: Question 12 Provide an appropriate response. For the stem-and-leaf plot below, what are the maximum…
A: From given stem-and-leaf plot the data set…
Q: Calculate the standard deviation of daily sales for Gilotti Pizzeria, Location 1. From Table 2.3 the…
A: Given: The data of daily sales for location 1 of Gilotti Pizzeria are:…
Q: Table 12.8 Speed for Selected Stride Lengths a. Adult men Stride length (meters) 2.5 3.0 3.3 3.5 3.8…
A:
Q: PART 1: Define/ Eaplain/Desuibe the foalloning Termi/Ph. 1. Statistics 2 Statistic G. Populotion 7.…
A: Statistics : Statistics is that the branch of arithmetic involved with the creation and study of…
Q: Problem 7. Calculate Inter quartile Range for the data given below : Class : 0-10 10-20 20-30 30-40…
A:
Q: QUESTION 22 Single-subject designs may be considered what form of research? O a. Basic O b.…
A: Since you have asked multiple questions, we will solve the first question for you. If you want any…
Q: 7. If the minimum value of data equal 10 and maximum value of data equal 50 and the number of class…
A:
Q: What is the ratio of deaths from gastroenteritis to heart disease in the total population, and in…
A: Given Data :
Q: Table 1: Gender * Duration of time in Malaysia (years) Less than 1-2 5 years or Gender 3-4 years…
A: The data is present in the rows and column format, where rows represent the gender of the students…
Q: Problem 2. (Exercise 6, Section 9.5.7) According to the Department of Motor Vehicles (DMV), the…
A: The sampling distribution of sample proportion of individuals weighing 100 pounds who will exceed…
Q: Table 2: Observation of Monocot & Dicot Monocot Dicot Location Serrated Lobed Leaf Smooth Serrated…
A: Percentage = Total/ Average ×100v
Q: Table 1:Age specific population and number of deaths of country A, Country B and Country C Age…
A: CDR is a measure in the fall in the population which takes place as a result of death.The following…
Q: Answer question #9. Show the graph of the rejection region.
A: Instruction : Answer question #9. Show the graph of the rejection region. Here, the given…
Q: Twenty-five army inductees in Ontario were given a blood test to determine their blood type. The…
A: Given info: Twenty-five army inductees in Ontario were given a blood test to determine their blood…
Q: Cite two reasons why the graph of figure 3 is important for understanding the issue of trafficking…
A: The two reasons are, Comparing the percentages for men and women helps us to find out which gender…
Q: Question Four If employees' salaries ( in hundred £) in company ABC are as follows: 11, 15, 17, 14,…
A: to find the summary of the whole data we use descriptive statistics. Descriptive statistics means…
Q: Scientific mass appraisal is a technique in which linear regression methods applied to the problem…
A:
Q: Problem # 2 Carbon monoxide (CO) level in the atmpospheric air is critial, and its detection and…
A: First we will calculate the mean and standard deviation of the data : sample size, n = 10 Sum, Σx =…
Q: Question 1 United Bank is studying the number of times the ATM, located in a shopping mall is used…
A: Given data is…
Q: Question 20 Which of the following is classified as quantitative data? A) Gender B) Eye color C)…
A: The quantitative data is the data whose value is in the form of counts or numbers. So Gender is the…
1. Hypothetical Age specific mortality data of A and C region

Step by step
Solved in 2 steps


- 10) Integrated circuits consist of electric channels that are etched onto silicon wafers. A certain proportion of circuits are defective because of "undercutting", which occurs when too much material is etched away so that the channels, which consist of the unetched portions of the wafers, are too narrow. A redesigned process, involving lower pressure in the etching chamber, is being investigated. The goal is to reduce the rate of undercutting to less than 5%. Out of the first 1000 circuits manufactured by the new process, only 32 show evidence of undercutting. If someone asks you the question "Can you conclude that the goal has been met?", what is the p-value that you'll report? Round the answer to four decimal places.Assuming a loss frequency of a loss occurring once every 2 years and that the average value of losses that occur might be $40,000. Based on the above examples the expected loss isThe ---------- of disease represents the rate of occurrence of new cases arising in each period in a specified population.
- 27. A set of observations recorded at a time period like 3- yearly, 5 yearly etc. is taken in the method of ______________. a. Standard deviation b. Time Series c. Regression d. CorrelationThe level of a pollutant in the river next to a chemical factory is monitored at regular intervals. Over the course of years, the level of the pollutant was determined by chemical analysis. In recent years, the company has made some changes in the factory where increases in the pollutant level can be observed. The environmental protection organization (EPA) wants convincing evidence that the level of the pollutant has not increased. By creating the relevant null and alternative hypotheses, I. type and II. describe type errors.Cardiovascular Disease Suppose the incidence rate of myocardial infarction (MI) was 5 per 1000 among 45- to 54-year-old men in 2000. To look at changes in incidence over time, 5000 men in this age group were followed for 1 year starting in 2010. Fifteen new cases of MI were found. Suppose that 25% of patients with Mi in 2000 died within 24 hours. This propartion is called the 24-hour case-fatality rate. Of the 15 new MI cases in the preceding study. 5 died within 24 hours. Test whether the 24-hour case- fatality rate changed from 2000 to 2010.
- True or false: a) When a process is in a state of statistical control, then most of the output will meet specifications. b) When a process is out of control, an unacceptably large proportion of the output will not meet specifications. c) When a process is in a state of statistical control, all the variation in the process is due to causes that are inherent in the process itself. d) When a process is out of control, some of the variation in the process is due to causes that are outside of the process.Gini coefficient is a statistic used to measure income inequality within nations. It ranges from 0 to 100, with higher scores indicating more inequality. At the extremes, a Gini score of 0 would mean that everyone in the country earns the exact same income, and a Gini score of 100 would mean that only one person in the country earns all the income. Some people argue that the larger a nation is, the more difficult it is to maintain a fair distribution of incomes. In other words, does income inequality increase as population size increases? You can test this question by conducting a bivariate regression on the data in the table below. Throughout calculating, and for the final answer, round to two decimals. ***Must show work on PDF for completing this computational table and for the following 9 questions*** Country (1) X: Population (in millions) (2) Y: Gini Score (3) (4) (5) (6) (7) Sweden 8 27 Ethiopia 77 29…Gini coefficient is a statistic used to measure income inequality within nations. It ranges from 0 to 100, with higher scores indicating more inequality. At the extremes, a Gini score of 0 would mean that everyone in the country earns the exact same income, and a Gini score of 100 would mean that only one person in the country earns all the income. Some people argue that the larger a nation is, the more difficult it is to maintain a fair distribution of incomes. In other words, does income inequality increase as population size increases? You can test this question by conducting a bivariate regression on the data in the table below. Throughout calculating, and for the final answer, round to two decimals. Country (1) X: Population (in millions) (2) Y: Gini Score (3) (4) (5) (6) (7) Sweden 8 27 Ethiopia 77 29 Switzerland 14 43 Laos 6 45 UK 58 35…
- Gini coefficient is a statistic used to measure income inequality within nations. It ranges from 0 to 100, with higher scores indicating more inequality. At the extremes, a Gini score of 0 would mean that everyone in the country earns the exact same income, and a Gini score of 100 would mean that only one person in the country earns all the income. Some people argue that the larger a nation is, the more difficult it is to maintain a fair distribution of incomes. In other words, does income inequality increase as population size increases? You can test this question by conducting a bivariate regression on the data in the table below. Throughout calculating, and for the final answer, round to two decimals. Country (1) X: Population (in millions) (2) Y: Gini Score (3) (4) (5) (6) (7) Sweden 8 27 Ethiopia 77 29 Switzerland 14 43 Laos 6 45 UK 58 35…Suppose the incidence rate of myocardial infarction (MI)was 5 per 1000 among 45- to 54-year-old men in 2000.To look at changes in incidence over time, 5000 men in thisage group were followed for 1 year starting in 2010. Fifteennew cases of MI were found. Suppose that 25% of patients with MI in 2000 died within24 hours. This proportion is called the 24-hour case-fatalityrate. >Suppose we eventually plan to accumulate 50 MIcases during the period 2010–2015. Assume that the24-hour case-fatality rate is truly 20% during this period.How much power would such a study have in distinguishingbetween case-fatality rates in 2000 and 2010–2015 if atwo-sided test with significance level .05 is planned?A set of observations recorded at a time period like 3- yearly, 5 yearly etc. is taken in the method of ______________. a. Time Series b. Correlation c. Regression d. Standard deviation


