Time (months) 012 34 5 Rate pollutants are escaping (tons/month) 2 37 1321 36 Use this data to sketch a smooth curve relating the two variables. Draw rectangles on the graph you drew to help you underestimate the total pollutants that escaped during the first month. What underestimate did you obtain? tons Draw rectangles on this graph to help you overestimate the total pollutants that escaped during the first month. What overestimate did you obtain? tons Draw rectangles on this graph to help you underestimate the total pollutants that escaped during the whole time. What underestimate did you obtain? tons Draw rectangles on this graph to help you overestimate the total pollutants that escaped during the whole time. What overestimate did you obtain? tons
Time (months) 012 34 5 Rate pollutants are escaping (tons/month) 2 37 1321 36 Use this data to sketch a smooth curve relating the two variables. Draw rectangles on the graph you drew to help you underestimate the total pollutants that escaped during the first month. What underestimate did you obtain? tons Draw rectangles on this graph to help you overestimate the total pollutants that escaped during the first month. What overestimate did you obtain? tons Draw rectangles on this graph to help you underestimate the total pollutants that escaped during the whole time. What underestimate did you obtain? tons Draw rectangles on this graph to help you overestimate the total pollutants that escaped during the whole time. What overestimate did you obtain? tons

Functions and Change: A Modeling Approach to College Algebra (MindTap Course List)
6th Edition
ISBN:9781337111348
Author:Bruce Crauder, Benny Evans, Alan Noell
Publisher:Bruce Crauder, Benny Evans, Alan Noell
Chapter2: Graphical And Tabular Analysis
Section2.6: Optimization
Problem 2E: Life Expectancy Versus Health Care Spending One article shows a relationship between per capita...

Related questions
Question
100%
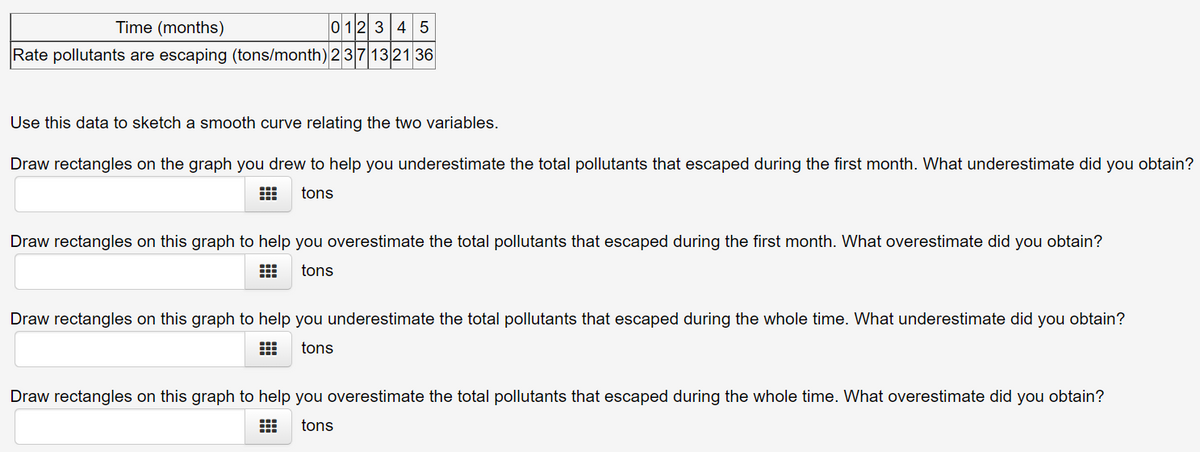
Transcribed Image Text:Time (months)
012 34 5
Rate pollutants are escaping (tons/month) 2371321 36
Use this data to sketch a smooth curve relating the two variables.
Draw rectangles on the graph you drew to help you underestimate the total pollutants that escaped during the first month. What underestimate did you obtain?
tons
Draw rectangles on this graph to help you overestimate the total pollutants that escaped during the first month. What overestimate did you obtain?
tons
Draw rectangles on this graph to help you underestimate the total pollutants that escaped during the whole time. What underestimate did you obtain?
tons
Draw rectangles on this graph to help you overestimate the total pollutants that escaped during the whole time. What overestimate did you obtain?
tons
Expert Solution
This question has been solved!
Explore an expertly crafted, step-by-step solution for a thorough understanding of key concepts.

This is a popular solution!

Trending now
This is a popular solution!

Step by step
Solved in 2 steps with 1 images

Recommended textbooks for you
Functions and Change: A Modeling Approach to Coll…
Algebra
ISBN:
9781337111348
Author:
Bruce Crauder, Benny Evans, Alan Noell
Publisher:
Cengage Learning


Algebra & Trigonometry with Analytic Geometry
Algebra
ISBN:
9781133382119
Author:
Swokowski
Publisher:
Cengage
Functions and Change: A Modeling Approach to Coll…
Algebra
ISBN:
9781337111348
Author:
Bruce Crauder, Benny Evans, Alan Noell
Publisher:
Cengage Learning
Algebra & Trigonometry with Analytic Geometry
Algebra
ISBN:
9781133382119
Author:
Swokowski
Publisher:
Cengage

Trigonometry (MindTap Course List)
Trigonometry
ISBN:
9781337278461
Author:
Ron Larson
Publisher:
Cengage Learning