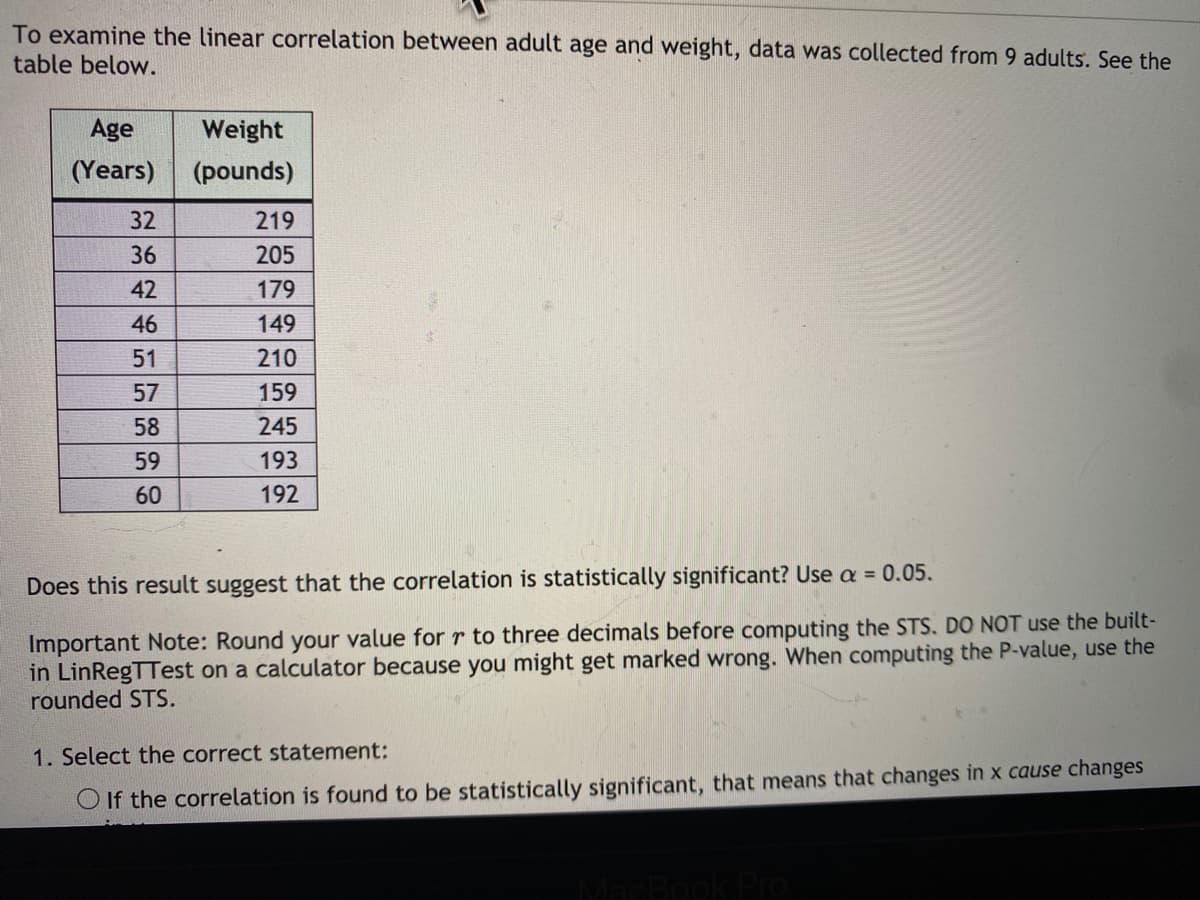
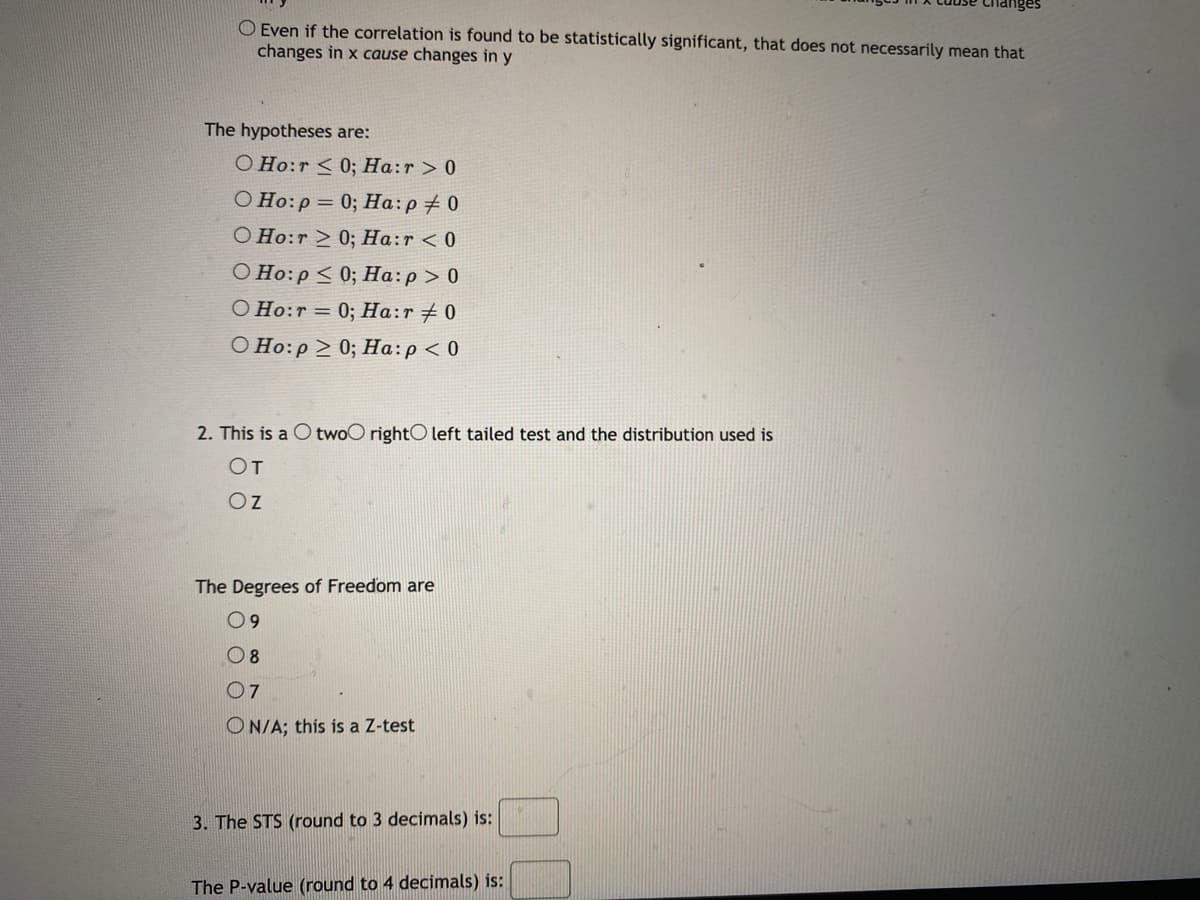
To examine the linear correlation between adult age and weight, data was collected from 9 adults. table below. Age Weight (Years) (pounds) 32 219 36 205 42 179 46 149 51 210 57 159 58 245 59 193 60 192 Does this result suggest that the correlation is statistically significant? Use a = 0.05. Important Note: Round your value for r to three decimals before computing the STS. DO NOT use the in LinRegTTest on a calculator because you might get marked wrong. When computing the P-value, u rounded STS. 1. Select the correct statement: O If the correlation is found to be statistically significant, that means that changes in x cause cha

Glencoe Algebra 1, Student Edition, 9780079039897, 0079039898, 2018
18th Edition
ISBN:9780079039897
Author:Carter
Publisher:Carter
Chapter4: Equations Of Linear Functions
Section4.5: Correlation And Causation
Problem 2CYU
icon
Related questions
icon
Concept explainers
Question
To examine the linear correlation between adult age and weight, data was collected from 9 adults. See the
table below.
Age
Weight
(Years) (pounds)
32
219
36
205
42
179
46
149
51
210
57
159
58
245
59
193
60
192
Does this result suggest that the correlation is statistically significant? Use a = 0.05.
Important Note: Round your value for r to three decimals before computing the STS. DO NOT use the built-
in LinRegTTest on a calculator because you might get marked wrong. When computing the P-value, use the
rounded STS.
1. Select the correct statement:
O If the correlation is found to be statistically significant, that means that changes in x cause changes
Transcribed Image Text:To examine the linear correlation between adult age and weight, data was collected from 9 adults. See the table below. Age Weight (Years) (pounds) 32 219 36 205 42 179 46 149 51 210 57 159 58 245 59 193 60 192 Does this result suggest that the correlation is statistically significant? Use a = 0.05. Important Note: Round your value for r to three decimals before computing the STS. DO NOT use the built- in LinRegTTest on a calculator because you might get marked wrong. When computing the P-value, use the rounded STS. 1. Select the correct statement: O If the correlation is found to be statistically significant, that means that changes in x cause changes
O Even if the correlation is found to be statistically significant, that does not necessarily mean that
changes in x cause changes in y
The hypotheses are:
O Ho:r < 0; Ha:r > 0
O Ho:p = 0; Ha:p+ 0
O Ho:r > 0; Ha:r < 0
O Ho:p < 0; Ha:p> 0
O Ho:r = 0; Ha:r+ 0
O Ho:p > 0; Ha:p < 0
2. This is a O twoO rightO left tailed test and the distribution used is
OT
Oz
The Degrees of Freedom are
09
07
O N/A; this is a Z-test
3. The STS (round to 3 decimals) is:
The P-value (round to 4 decimals) is:
Transcribed Image Text:O Even if the correlation is found to be statistically significant, that does not necessarily mean that changes in x cause changes in y The hypotheses are: O Ho:r < 0; Ha:r > 0 O Ho:p = 0; Ha:p+ 0 O Ho:r > 0; Ha:r < 0 O Ho:p < 0; Ha:p> 0 O Ho:r = 0; Ha:r+ 0 O Ho:p > 0; Ha:p < 0 2. This is a O twoO rightO left tailed test and the distribution used is OT Oz The Degrees of Freedom are 09 07 O N/A; this is a Z-test 3. The STS (round to 3 decimals) is: The P-value (round to 4 decimals) is:
Expert Solution
steps

Step by step

Solved in 3 steps with 3 images

Blurred answer
Knowledge Booster
Correlation, Regression, and Association
Learn more about
Need a deep-dive on the concept behind this application? Look no further. Learn more about this topic, statistics and related others by exploring similar questions and additional content below.
Recommended textbooks for you
Glencoe Algebra 1, Student Edition, 9780079039897…
Algebra
ISBN:
9780079039897
Author:
Carter
Publisher:
McGraw Hill
Big Ideas Math A Bridge To Success Algebra 1: Stu…
Algebra
ISBN:
9781680331141
Author:
HOUGHTON MIFFLIN HARCOURT
Publisher:
Houghton Mifflin Harcourt