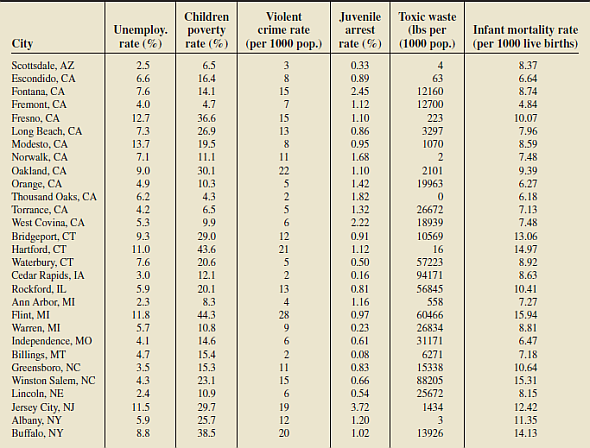
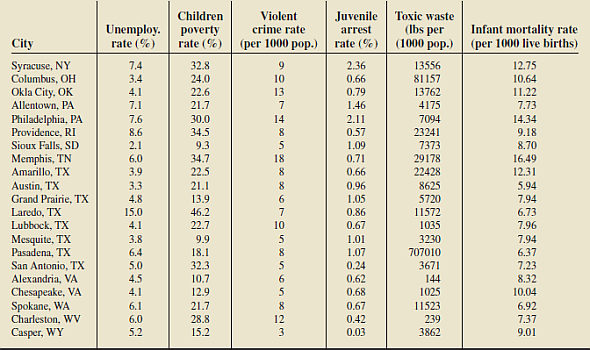
Toxic waste (Ibs per (1000 pop.) Children Violent crime rate Juvenile Unemploy. rate (%) poverty rate (%) Infant mortality rate (per 1000 live births) arrest City (per 1000 pop.) rate (%) Scottsdale, AZ Escondido, CA 2.5 6.5 0.33 8.37 6.6 16.4 0.89 63 6.64 Fontana, CA 7.6 14.1 15 2.45 12160 8.74 Fremont, CA 4.0 4.7 1.12 12700 4.84 Fresno, CA 12.7 36.6 15 1.10 223 10.07 Long Beach, CA. Modesto, CA Norwalk, CA 7.3 26.9 13 0.86 3297 7.96 13.7 19.5 0.95 1070 8.59 7.1 11.1 11 1.68 7.48 Oakland, CA Orange, CA Thousand Oaks, CA Torrance, CA West Covina, CA 30.1 10.3 4.3 22 2101 9.39 6.27 9.0 4.9 6.2 4.2 1.10 1.42 1.82 1.32 19963 6.18 6.5 26672 18939 7.13 5.3 9.9 2.22 7.48 Bridgeport, CT Hartford, CT 9.3 29.0 12 0.91 10569 13.06 11.0 43.6 21 1.12 16 14.97 Waterbury, CT Cedar Rapids, IA 7.6 20.6 0.50 57223 8.92 3.0 12.1 0.16 94171 8.63 Rockford, IL Ann Arbor, MI Flint, MI Warren, MI Independence, MO Billings, MT Greensboro, NC Winston Salem, NC Lincoln, NE 5.9 20.1 13 0.81 56845 10.41 2.3 8.3 1.16 558 7.27 60466 26834 31171 11.8 44.3 28 0.97 15.94 5.7 10.8 9. 0.23 8.81 4.1 14.6 6. 0.61 6.47 0.08 4.7 3.5 15.4 6271 7.18 15.3 11 0.83 15338 10.64 4.3 23.1 15 0.66 88205 15.31 2.4 10.9 0.54 25672 8.15 Jersey City, NJ Albany, NY Buffalo, NY 11.5 29.7 19 3.72 1434 12.42 5.9 25.7 12 1.20 11.35 8.8 38.5 20 1.02 13926 14.13 Toxic waste (Ibs per (1000 pop.) Children Violent crime rate Juvenile Unemploy. rate (%) poverty rate (%) Infant mortality rate (per 1000 live births) arrest City (per 1000 pop.) rate (%) Syracuse, NY Columbus, OH Okla City. OK 7.4 3.4 4.1 32.8 24.0 9. 2.36 0.66 0.79 13556 81157 12.75 10 10.64 22.6 13 13762 11.22 Allentown, PA 7.1 21.7 1.46 4175 7.73 14.34 Philadelphia, PA Providence, RI Sioux Falls, SD Memphis, TN Amarillo, TX Austin, TX 7.6 30.0 14 2.11 7094 8.6 34.5 0.57 23241 9.18 2.1 9.3 1.09 7373 29178 22428 8.70 6.0 3.9 34.7 22.5 18 8. 0.71 16.49 12.31 0.66 3.3 21.1 8625 5720 0.96 5.94 Grand Prairie, TX 4.8 13.9 6. 1.05 7.94 Laredo, TX Lubbock, TX 15.0 46.2 0.86 11572 6.73 4.1 22.7 10 0.67 1035 7.96 Mesquite, TX Pasadena, TX San Antonio, TX 3.8 9.9 1.01 3230 7.94 6.4 18.1 1.07 707010 6.37 5.0 4.5 32.3 10.7 0.24 0.62 3671 7.23 8.32 10.04 Alexandria, VA Chesapeake, VA Spokane, WA Charleston, WV Casper, WY 6. 144 4.1 12.9 0.68 1025 6.1 21.7 8. 0.67 11523 6.92 6.0 28.8 12 0.42 239 7.37 5.2 15.2 3. 0.03 3862 9.01


Correlation
Correlation defines a relationship between two independent variables. It tells the degree to which variables move in relation to each other. When two sets of data are related to each other, there is a correlation between them.
Linear Correlation
A correlation is used to determine the relationships between numerical and categorical variables. In other words, it is an indicator of how things are connected to one another. The correlation analysis is the study of how variables are related.
Regression Analysis
Regression analysis is a statistical method in which it estimates the relationship between a dependent variable and one or more independent variable. In simple terms dependent variable is called as outcome variable and independent variable is called as predictors. Regression analysis is one of the methods to find the trends in data. The independent variable used in Regression analysis is named Predictor variable. It offers data of an associated dependent variable regarding a particular outcome.
Consider a multiple linear regression relating the response variable, y, to three predictor variables, x1, x2, and x3.
a. Find the number of possible regression equations than involve subsets of the three predictor variables.
b. List explicitly the possible subsets of the three predictor variables.

Step by step
Solved in 2 steps with 2 images


