Trying to construct a graph that shows U.S. Demand curve for sugar. U.S. Supply curve for sugar. Show world price and U.S. price (show dollar values).
Trying to construct a graph that shows U.S. Demand curve for sugar. U.S. Supply curve for sugar. Show world price and U.S. price (show dollar values).

Chapter1: Making Economics Decisions
Section: Chapter Questions
Problem 1QTC

Related questions
Question
Trying to construct a graph that shows
- U.S.
Demand curve for sugar. - U.S. Supply curve for sugar.
- Show world price and U.S. price (show dollar values).
- Show quantity supplied by U.S. firms and U.S. sugar consumption on graph (show values). Quantity is in pounds. These values are on the attached files.
- Figure how many pounds of sugar are imported. This will be a value. Show it on the graph.
- Shade the area(s) of dead-weight loss on the graph (no value needed).
- Mark the area which is the revenue for foreign sugar producers—figure the dollar value and note it on the graph.
| Sugar consumption in the U.S. 2009-2019 | |
| Pounds (Billions) |
|
| 2009 | 21.82 |
| 2010 | 22.48 |
| 2011 | 22.26 |
| 2012 | 22.92 |
| 2013 | 23.58 |
| 2014 | 23.80 |
| 2015 | 23.80 |
| 2016 | 24.20 |
| 2017 | 24.09 |
| 2018 | 24.20 |
| 2019 | 24.25 |
| Sugar production in the U.S. 2009-2019 | |
| Pounds (Billions) |
|
| 2009 | 15.87 |
| 2010 | 15.65 |
| 2011 | 16.97 |
| 2012 | 17.85 |
| 2013 | 16.97 |
| 2014 | 17.30 |
| 2015 | 17.98 |
| 2016 | 17.94 |
| 2017 | 18.58 |
| 2018 | 17.98 |
| 2019 | 16.05 |
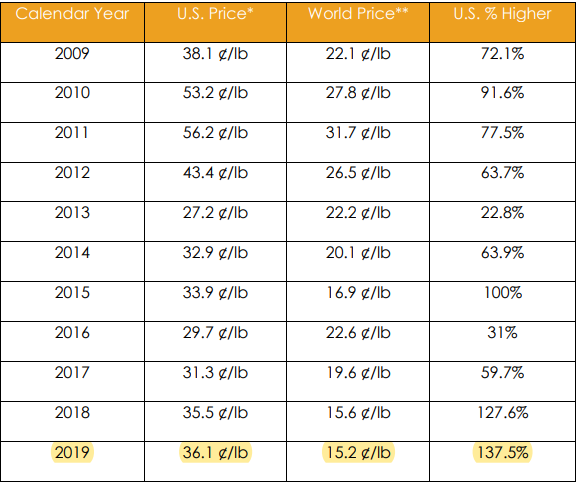
Transcribed Image Text:Calendar Year
U.S. Price*
World Price**
U.S. % Higher
2009
38.1 ¢/lb
22.1 g/lb
72.1%
2010
53.2 g/lb
27.8 g/lb
91.6%
2011
56.2 g/lb
31.7 ¢/lb
77.5%
2012
43.4 ¢/lb
26.5 g/lb
63.7%
2013
27.2 ¢/lb
22.2 ¢/lb
22.8%
2014
32.9 ¢/lb
20.1 g/lb
63.9%
2015
33.9 ¢/lb
16.9 ¢/lb
100%
2016
29.7 ¢/lb
22.6 g/lb
31%
2017
31.3 ¢/lb
19.6 g/lb
59.7%
2018
35.5 ¢/lb
15.6 g/lb
127.6%
2019
36.1 g/lb
15.2 g/lb
137.5%
Expert Solution
Step 1
For a given information -
Demand is given by the amount consumed at given price levels .
Supply is given by the amount produced at given price levels .
Demand and supply curves are drawn on price & quantity space with prices on y-axis & Quantity on x - axis .

Trending now
This is a popular solution!

Step by step
Solved in 2 steps with 2 images

Knowledge Booster


Learn more about
Need a deep-dive on the concept behind this application? Look no further. Learn more about this topic, economics and related others by exploring similar questions and additional content below.Recommended textbooks for you

Principles of Economics (12th Edition)
Economics
ISBN:
9780134078779
Author:
Karl E. Case, Ray C. Fair, Sharon E. Oster
Publisher:
PEARSON

Engineering Economy (17th Edition)
Economics
ISBN:
9780134870069
Author:
William G. Sullivan, Elin M. Wicks, C. Patrick Koelling
Publisher:
PEARSON
Principles of Economics (12th Edition)
Economics
ISBN:
9780134078779
Author:
Karl E. Case, Ray C. Fair, Sharon E. Oster
Publisher:
PEARSON
Engineering Economy (17th Edition)
Economics
ISBN:
9780134870069
Author:
William G. Sullivan, Elin M. Wicks, C. Patrick Koelling
Publisher:
PEARSON

Principles of Economics (MindTap Course List)
Economics
ISBN:
9781305585126
Author:
N. Gregory Mankiw
Publisher:
Cengage Learning

Managerial Economics: A Problem Solving Approach
Economics
ISBN:
9781337106665
Author:
Luke M. Froeb, Brian T. McCann, Michael R. Ward, Mike Shor
Publisher:
Cengage Learning

Managerial Economics & Business Strategy (Mcgraw-…
Economics
ISBN:
9781259290619
Author:
Michael Baye, Jeff Prince
Publisher:
McGraw-Hill Education