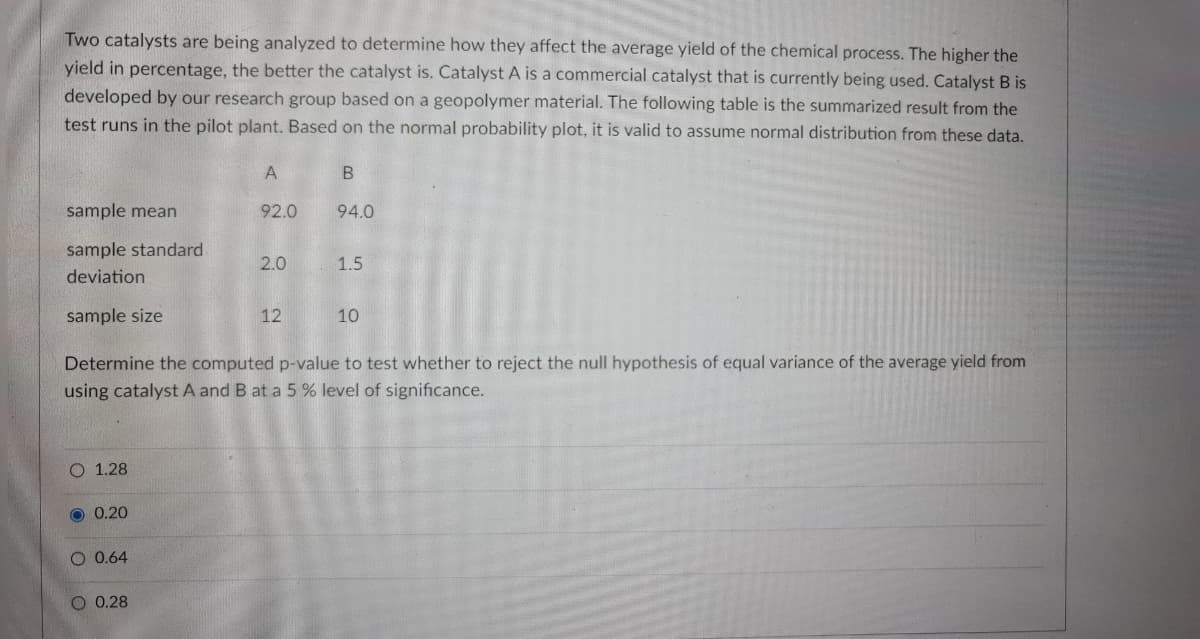
Two catalysts are being analyzed to determine how they affect the average yield of the chemical process. The higher the yield in percentage, the better the catalyst is. Catalyst A is a commercial catalyst that is currently being used. Catalyst B is developed by our research group based on a geopolymer material. The following table is the summarized result from the test runs in the pilot plant. Based on the normal probability plot, it is valid to assume normal distribution from these data. A sample mean 92.0 94.0 sample standard 2.0 1.5 deviation sample size 12 10 Determine the computed p-value to test whether to reject the null hypothesis of equal variance of the average yield from using catalyst A and B at a 5 % level of significance. O 1.28 O 0.20 O 0.64 O 0.28
Two catalysts are being analyzed to determine how they affect the average yield of the chemical process. The higher the yield in percentage, the better the catalyst is. Catalyst A is a commercial catalyst that is currently being used. Catalyst B is developed by our research group based on a geopolymer material. The following table is the summarized result from the test runs in the pilot plant. Based on the normal probability plot, it is valid to assume normal distribution from these data. A sample mean 92.0 94.0 sample standard 2.0 1.5 deviation sample size 12 10 Determine the computed p-value to test whether to reject the null hypothesis of equal variance of the average yield from using catalyst A and B at a 5 % level of significance. O 1.28 O 0.20 O 0.64 O 0.28

Glencoe Algebra 1, Student Edition, 9780079039897, 0079039898, 2018
18th Edition
ISBN:9780079039897
Author:Carter
Publisher:Carter
Chapter10: Statistics
Section10.4: Distributions Of Data
Problem 19PFA

Related questions
Question
pls answer28
Transcribed Image Text:Two catalysts are being analyzed to determine how they affect the average yield of the chemical process. The higher the
yield in percentage, the better the catalyst is. Catalyst A is a commercial catalyst that is currently being used. Catalyst B is
developed by our research group based on a geopolymer material. The following table is the summarized result from the
test runs in the pilot plant. Based on the normal probability plot, it is valid to assume normal distribution from these data.
sample mean
92.0
94.0
sample standard
2.0
1.5
deviation
sample size
12
10
Determine the computed p-value to test whether to reject the null hypothesis of equal variance of the average yield from
using catalyst A and B at a 5 % level of significance.
O 1.28
O 0.20
O 0.64
O 0.28
Expert Solution
This question has been solved!
Explore an expertly crafted, step-by-step solution for a thorough understanding of key concepts.

Step by step
Solved in 2 steps with 2 images

Recommended textbooks for you
Glencoe Algebra 1, Student Edition, 9780079039897…
Algebra
ISBN:
9780079039897
Author:
Carter
Publisher:
McGraw Hill
Glencoe Algebra 1, Student Edition, 9780079039897…
Algebra
ISBN:
9780079039897
Author:
Carter
Publisher:
McGraw Hill