Two catalysts are being analyzed to determine how they affect the average yield of the chemical process. The higher the yield in percentage, the better the catalyst is. Catalyst A is a commercial catalyst that is currently being used. Catalyst B is developed by our research group based on a geopolymer material. The following table is the summarized result from the test runs in the pilot plant. Based on the normal probability plot, it is valid to assume normal distribution from these data. sample mean 92.0 94.0 sample standard 2.0 3.0 deviation sample size 10 12 Determine the computed p-value to test whether to reject the null hypothesis that there is no significant difference between the average yield from using catalyst A and B at 5 % level of significance. O 0.053 O 0.005 O 0.015 O 0.087
Two catalysts are being analyzed to determine how they affect the average yield of the chemical process. The higher the yield in percentage, the better the catalyst is. Catalyst A is a commercial catalyst that is currently being used. Catalyst B is developed by our research group based on a geopolymer material. The following table is the summarized result from the test runs in the pilot plant. Based on the normal probability plot, it is valid to assume normal distribution from these data. sample mean 92.0 94.0 sample standard 2.0 3.0 deviation sample size 10 12 Determine the computed p-value to test whether to reject the null hypothesis that there is no significant difference between the average yield from using catalyst A and B at 5 % level of significance. O 0.053 O 0.005 O 0.015 O 0.087

Chapter8: Sequences, Series,and Probability
Section8.7: Probability
Problem 11ECP: A manufacturer has determined that a machine averages one faulty unit for every 500 it produces....

Related questions
Question
27.
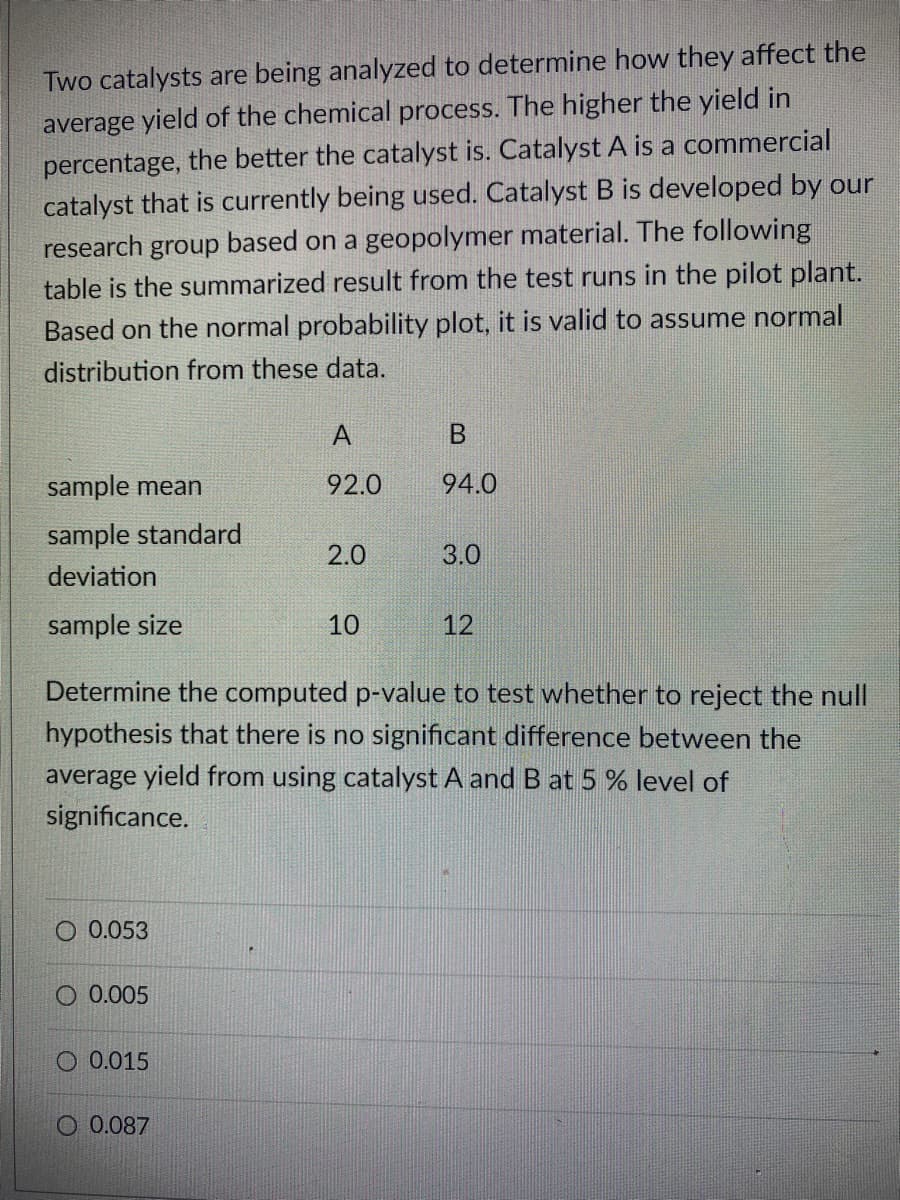
Transcribed Image Text:Two catalysts are being analyzed to determine how they affect the
average yield of the chemical process. The higher the yield in
percentage, the better the catalyst is. Catalyst A is a commercial
catalyst that is currently being used. Catalyst B is developed by our
research group based on a geopolymer material. The following
table is the summarized result from the test runs in the pilot plant.
Based on the normal probability plot, it is valid to assume normal
distribution from these data.
A
sample mean
92.0
94.0
sample standard
2.0
3.0
deviation
sample size
10
12
Determine the computed p-value to test whether to reject the null
hypothesis that there is no significant difference between the
average yield from using catalyst A and B at 5 % level of
significance.
O 0.053
O 0.005
O 0.015
O 0.087
Expert Solution
This question has been solved!
Explore an expertly crafted, step-by-step solution for a thorough understanding of key concepts.

Step by step
Solved in 2 steps with 1 images

Recommended textbooks for you