A researcher wanted to determine if carpeted or uncarpeted rooms contain more bacteria. The table shows the results for the number of bacteria per cubic foot for both types of rooms. A normal probability plot and boxplot indicate that the data are approximately normally distributed with no outliers. Do carpeted rooms have more bacteria than uncarpeted rooms at the a= 0.01 level of significance? Full data setO Uncarpeted 6.2 Carpeted 12.8 9.4 9 9.3 10.4 7.8 6.4 10.4 8.7 11.9 9.5 10.8 13.6 3.3 12.3 E Click the icon to view the Student t-distribution table. What are the null and alternative hypotheses? Student t-distribution Ho: | versus H,: Calculate the test statistic, to- o = (Round to two decimal places as needed.) Now find the critical value. Select the correct choice below and fill in the answer box within your choice. (Round to three decimal places as needed.) Arca in right tal O A. tu/2= -Distribution Area in Right Tail O B. =| Degrees of Freedom 0.25 0.20 015 0.10 0,05 0,025 0.005 0.0025 0.001 0.0005 L000 0816 0.765 0.741 0.727 1963 3.078 1886 1638 1.533 1.476 6.314 2.920 2.353 2.132 2015 12.706 15.894 4.849 3482 2.999 2.757 31821 6.965 4.541 3.747 3.365 63.657 127321 318309 636.619 14.089 2453 5598 4.773 1.376 Do carpeted rooms have more bacteria than uncarpeted rooms at the a=0.01 level of significance? 1.061 1386 4.303 3.182 0.978 1250 0.941 1.190 1156 0.920 9.925 5841 4.604 4.032 22.327 10.215 Z173 31.599 12.924 8610 6869 2.776 2571 O A. No, because the test statistic is in the critical region. O B. Yes, because the test statistic is not in the critical region. OC. No, because the test statistic is not in the critical region. 5893 0.718 0.711 0.706 0.906 0.806 0.889 0883 O870 1134 L119 1108 1100 1.943 1.895 1860 1833 1812 2.447 2365 2.306 2.262 2.228 2.612 2.517 2.449 2.398 2.359 3.143 2.998 2.896 2821 2.764 3.707 1.440 1415 1397 1383 1372 3.499 3.355 3.250 3.169 4317 4.029 3.833 3.690 3.581 5.208 4.785 4.501 4.297 4.144 5.959 5.408 5.041 4.781 4.587 0.703 0.700 10 1093 On Yer hecaure the tert statistic is in the critical region 1407
A researcher wanted to determine if carpeted or uncarpeted rooms contain more bacteria. The table shows the results for the number of bacteria per cubic foot for both types of rooms. A normal probability plot and boxplot indicate that the data are approximately normally distributed with no outliers. Do carpeted rooms have more bacteria than uncarpeted rooms at the a= 0.01 level of significance? Full data setO Uncarpeted 6.2 Carpeted 12.8 9.4 9 9.3 10.4 7.8 6.4 10.4 8.7 11.9 9.5 10.8 13.6 3.3 12.3 E Click the icon to view the Student t-distribution table. What are the null and alternative hypotheses? Student t-distribution Ho: | versus H,: Calculate the test statistic, to- o = (Round to two decimal places as needed.) Now find the critical value. Select the correct choice below and fill in the answer box within your choice. (Round to three decimal places as needed.) Arca in right tal O A. tu/2= -Distribution Area in Right Tail O B. =| Degrees of Freedom 0.25 0.20 015 0.10 0,05 0,025 0.005 0.0025 0.001 0.0005 L000 0816 0.765 0.741 0.727 1963 3.078 1886 1638 1.533 1.476 6.314 2.920 2.353 2.132 2015 12.706 15.894 4.849 3482 2.999 2.757 31821 6.965 4.541 3.747 3.365 63.657 127321 318309 636.619 14.089 2453 5598 4.773 1.376 Do carpeted rooms have more bacteria than uncarpeted rooms at the a=0.01 level of significance? 1.061 1386 4.303 3.182 0.978 1250 0.941 1.190 1156 0.920 9.925 5841 4.604 4.032 22.327 10.215 Z173 31.599 12.924 8610 6869 2.776 2571 O A. No, because the test statistic is in the critical region. O B. Yes, because the test statistic is not in the critical region. OC. No, because the test statistic is not in the critical region. 5893 0.718 0.711 0.706 0.906 0.806 0.889 0883 O870 1134 L119 1108 1100 1.943 1.895 1860 1833 1812 2.447 2365 2.306 2.262 2.228 2.612 2.517 2.449 2.398 2.359 3.143 2.998 2.896 2821 2.764 3.707 1.440 1415 1397 1383 1372 3.499 3.355 3.250 3.169 4317 4.029 3.833 3.690 3.581 5.208 4.785 4.501 4.297 4.144 5.959 5.408 5.041 4.781 4.587 0.703 0.700 10 1093 On Yer hecaure the tert statistic is in the critical region 1407

Glencoe Algebra 1, Student Edition, 9780079039897, 0079039898, 2018
18th Edition
ISBN:9780079039897
Author:Carter
Publisher:Carter
Chapter10: Statistics
Section: Chapter Questions
Problem 25SGR

Related questions
Question
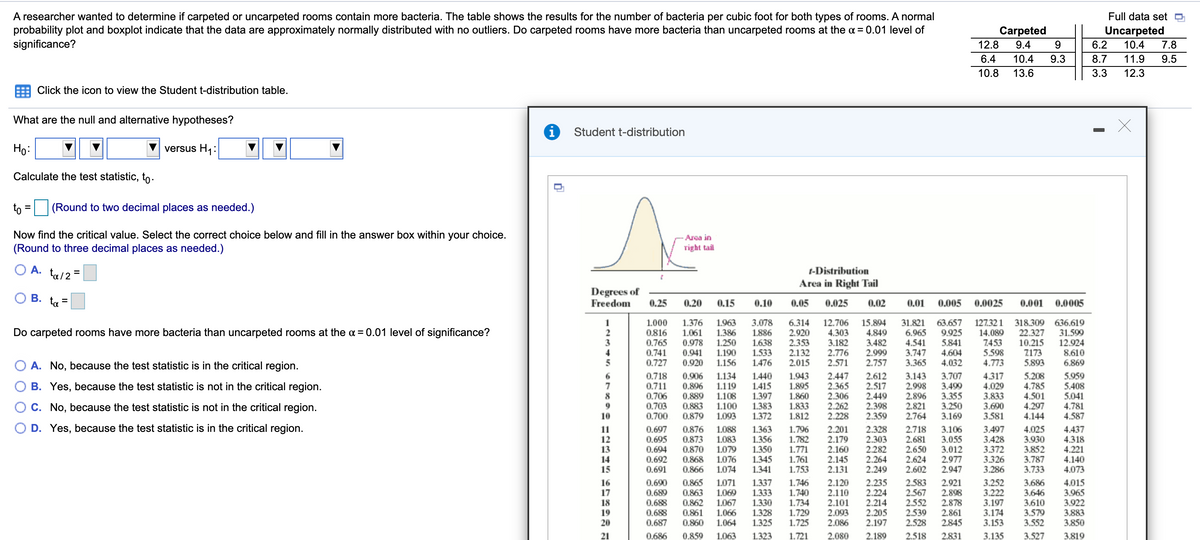
Transcribed Image Text:A researcher wanted to determine if carpeted or uncarpeted rooms contain more bacteria. The table shows the results for the number of bacteria per cubic foot for both types of rooms. A normal
probability plot and boxplot indicate that the data are approximately normally distributed with no outliers. Do carpeted rooms have more bacteria than uncarpeted rooms at the a = 0.01 level of
significance?
Full data set
Carpeted
Uncarpeted
12.8
9.4
9.
6.2
10.4
7.8
6.4
10.4
9.3
8.7
11.9
9.5
10.8
13.6
3.3
12.3
Click the icon to view the Student t-distribution table.
What are the null and alternative hypotheses?
Student t-distribution
Ho:
versus H1:
Calculate the test statistic, to -
to
(Round to two decimal places as needed.)
Now find the critical value. Select the correct choice below and fill in the answer box within your choice.
(Round to three decimal places as needed.)
Area in
right tail
O A. ta/2 =
t-Distribution
Area in Right Tail
Degrees of
Freedom
B. ta
%D
0.25
0.20
0.15
0.10
0.05
0.025
0.02
0.01
0.005
0.0025
0.001
0.0005
1.000
0.816
0.765
0.741
0.727
15.894
4.849
3.482
2.999
2.757
1.963
1.376
1.061
0.978
0.941
0.920
3.078
1.886
1.638
1.533
1.476
6.314
2.920
2.353
2.132
2.015
12.706
4.303
3.182
2.776
2.571
31.821
6.965
4.541
3.747
3.365
63.657
9.925
5.841
4.604
4.032
127.32 1
14.089
7.453
5.598
4.773
318.309 636.619
31.599
12.924
8.610
6.869
Do carpeted rooms have more bacteria than uncarpeted rooms at the a = 0.01 level of significance?
1.386
1.250
1.190
1.156
22.327
10.215
7173
5.893
3
O A. No, because the test statistic is in the critical region.
5
0.718
0.711
0.706
0.703
0.700
0.906
0.896
0.889
0.883
0.879
1.134
1.119
1.108
1.100
1.093
2.612
2.517
2.449
2.398
2.359
4.317
4.029
3.833
3.690
3.581
5.208
4.785
4.501
4.297
4.144
5.959
5.408
5.041
4.781
1.440
1.415
1.943
1.895
2.447
2.365
2.306
2.262
2.228
3.143
2.998
2.896
2.821
2.764
3.707
3.499
3.355
3.250
3.169
B. Yes, because the test statistic is not in the critical region.
8
1.397
1.383
1.372
1.860
1.833
1.812
C. No, because the test statistic is not in the critical region.
10
4.587
D. Yes, because the test statistic is in the critical region.
3.497
3.428
3.372
3.326
3.286
4.025
3.930
3.852
4.437
4.318
4.221
4.140
4.073
0.697
0.695
0.876
0.873
0.870
0.868
0.866
1.363
2.201
2.179
2.160
2.145
2.131
2.328
11
12
13
14
15
1.088
1.083
1.356
1.350
1.345
1.341
1.796
1.782
1.771
1.761
1.753
2.718
2.681
2.650
3.106
3.055
3.012
2.977
2.947
2.303
2.282
0.694
0.692
0.691
1.079
1.076
1.074
2.264
2.249
2.624
2.602
3.787
3.733
0.690
0.689
0.688
0.688
0.687
1.071
1.069
1.067
1.066
1.064
2.235
2.224
2.214
2.205
2.197
0.865
1.337
1.333
1.330
2.120
2.110
2.101
2.093
2.086
2.583
2.567
2.552
2.539
2.528
3.252
3.222
16
17
18
19
20
1.746
1.740
1.734
1.729
1.725
2.921
2.898
2.878
3.686
3.646
3.610
3.579
3.552
4.015
3.965
3.922
3.883
3.850
0.863
0.862
0.861
0.860
1.328
1.325
2.861
2.845
3.197
3.174
3.153
21
0.686
0.859
1.063
1.323
1.721
2.080
2.189
2.518
2.831
3.135
3.527
3.819
Expert Solution
This question has been solved!
Explore an expertly crafted, step-by-step solution for a thorough understanding of key concepts.

This is a popular solution!

Trending now
This is a popular solution!

Step by step
Solved in 2 steps with 1 images

Knowledge Booster


Learn more about
Need a deep-dive on the concept behind this application? Look no further. Learn more about this topic, statistics and related others by exploring similar questions and additional content below.Recommended textbooks for you
Glencoe Algebra 1, Student Edition, 9780079039897…
Algebra
ISBN:
9780079039897
Author:
Carter
Publisher:
McGraw Hill
Glencoe Algebra 1, Student Edition, 9780079039897…
Algebra
ISBN:
9780079039897
Author:
Carter
Publisher:
McGraw Hill