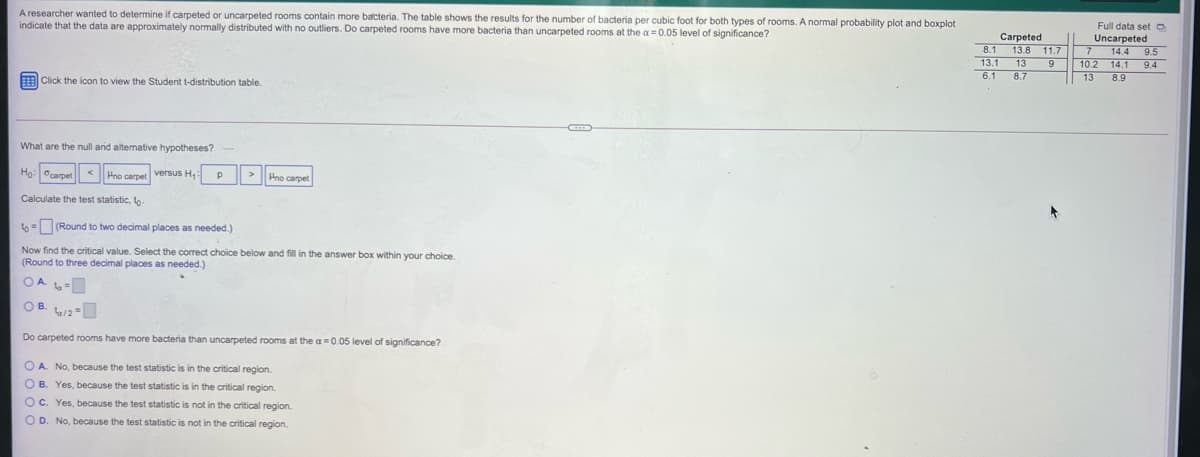
A researcher wanted to determine if carpeted or uncarpeted rooms contain more bacteria. The table shows the results for the number of bacteria per cubic foot for both types of rooms. A normal probability plot and boxplot indicate that the data are approximately normally distributed with no outliers. Do carpeted rooms have more bacteria than uncarpeted rooms at the a0.05 level of significance? Full data set O Uncarpeted Carpeted 8.1 13.8 11.7 13.1 13 6.1 8.7 9.5 14.1 8.9 14.4 10.2 13 9.4 E Click the icon to view the Student t-distribution table. What are the null and altemative hypotheses? Ho: carpetHno carpet Calculate the test statistic, to- to = (Round to two decimal places as needed.) Now find the critical value. Select the correct choice below and fill in the answer box within your choice. (Round to three decimal places as needed.) OA 6- OB. la/2- Do carpeted rooms have more bacteria than uncarpeted rooms at the a=0.05 level of significance? O A No, because the test statistic is in the critical region. O B. Yes, because the test statistic is in the critical region. O C. Yes, because the test statistic is not in the critical region. O D. No, because the test statistic is not in the critical region.
A researcher wanted to determine if carpeted or uncarpeted rooms contain more bacteria. The table shows the results for the number of bacteria per cubic foot for both types of rooms. A normal probability plot and boxplot indicate that the data are approximately normally distributed with no outliers. Do carpeted rooms have more bacteria than uncarpeted rooms at the a0.05 level of significance? Full data set O Uncarpeted Carpeted 8.1 13.8 11.7 13.1 13 6.1 8.7 9.5 14.1 8.9 14.4 10.2 13 9.4 E Click the icon to view the Student t-distribution table. What are the null and altemative hypotheses? Ho: carpetHno carpet Calculate the test statistic, to- to = (Round to two decimal places as needed.) Now find the critical value. Select the correct choice below and fill in the answer box within your choice. (Round to three decimal places as needed.) OA 6- OB. la/2- Do carpeted rooms have more bacteria than uncarpeted rooms at the a=0.05 level of significance? O A No, because the test statistic is in the critical region. O B. Yes, because the test statistic is in the critical region. O C. Yes, because the test statistic is not in the critical region. O D. No, because the test statistic is not in the critical region.
Glencoe Algebra 1, Student Edition, 9780079039897, 0079039898, 2018
18th Edition
ISBN:9780079039897
Author:Carter
Publisher:Carter
Chapter10: Statistics
Section10.4: Distributions Of Data
Problem 19PFA
Related questions
Question
8: Need help

Transcribed Image Text:A researcher wanted to determine if carpeted or uncarpeted rooms contain more bacteria. The table shows the results for the number of bacteria per cubic foot for both types of rooms. A normal probability plot and boxplot
indicate that the data are approximately normally distributed with no outliers. Do carpeted rooms have more bacteria than uncarpeted rooms at the a 0.05 level of significance?
Full data set O
Carpeted
8.1
13.1
6.1
Uncarpeted
14.4 9.5
14.
13
13.8 11.7 7
13
10.2
9.4
8.7
8.9
E Click the icon to view the Student t-distribution table.
What are the null and altemative hypotheses?-
Ho: carpet < Hno carpet versus H1
Hno carpet
Calculate the test statistic, to
to = (Round to two decimal places as needed.)
Now find the critical value. Select the correct choice below and fill in the answer box within your choice.
(Round to three decimal places as needed.)
OA l=
OB. tu/2=
Do carpeted rooms have more bacteria than uncarpeted rooms at the a=0.05 level of significance?
O A. No, because the test statistic is in the critical region.
O B. Yes, because the test statistic is in the critical region.
O C. Yes, because the test statistic is not in the critical region.
O D. No, because the test statistic is not in the critical region.
Expert Solution
Step 1
| Carpeted | Uncarpeted |
| 8.1,13.8,11.7,13.1,13,9,6.1,8.7 | 7,14.4,9.5,10.2,14.1,9.4,13,8.9 |
The data are approximately normally distributed with no outliers.
level of significance α = 0.05
Step by step
Solved in 4 steps

Recommended textbooks for you

Glencoe Algebra 1, Student Edition, 9780079039897…
Algebra
ISBN:
9780079039897
Author:
Carter
Publisher:
McGraw Hill

Glencoe Algebra 1, Student Edition, 9780079039897…
Algebra
ISBN:
9780079039897
Author:
Carter
Publisher:
McGraw Hill