
Related questions
Concept explainers
using pandas, python
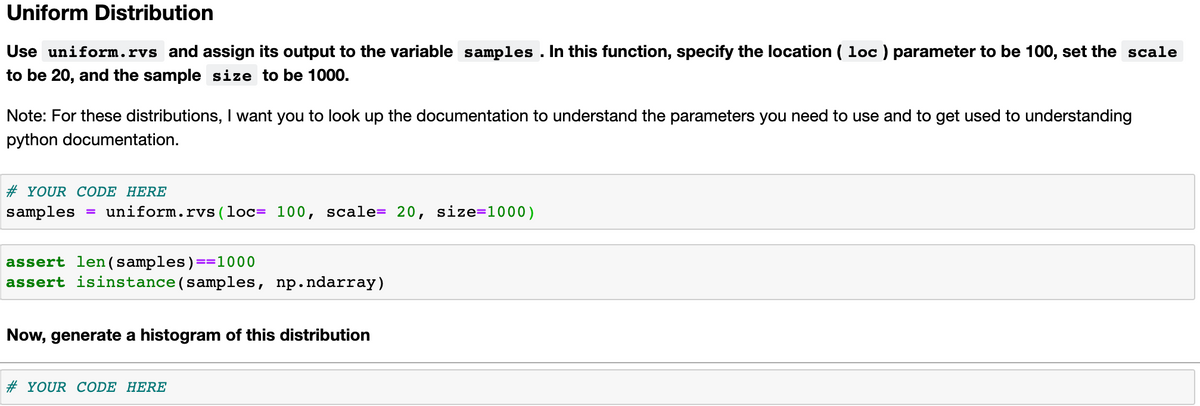
Uniform Distribution
Use uniform.rvs and assign its output to the variable samples. In this function, specify the location (loc) parameter to be 100, set the scale to be 20, and the sample size to be 1000 and generate histogram.

Using python:
Import packages:
# import uniform distribution
from scipy.stats import uniform
import numpy as np
# import seaborn
import seaborn as sns
# settings for seaborn plotting style
sns.set(color_codes=True)
# settings for seaborn plot sizes
sns.set(rc={'figure.figsize':(5,5)})
uniform function generate uniform continuous variable between the specified interval through its loc and scale arguments.
samples=uniform.rvs(loc=100,scale=20,size=1000)
assert len(samples)==1000
assert isinstance(samples, np.ndarray)
use Seaborn’s distplot to plot the histogram of the distribution:
ax = sns.distplot(samples,
bins=100,
kde=True,
color='skyblue',
hist_kws={"linewidth": 15,'alpha':1})
ax.set(xlabel='Uniform Distribution ', ylabel='Frequency')

Trending nowThis is a popular solution!

Step by stepSolved in 2 steps with 1 images


- Implement the Linear regression for multiple variables. code in python and execute and take screen shot of code and output use PYTHON IDLE GIVE EXPLANATION TO SAMPLE CODE EXECUTED. please use 201916778 as a file name thank you in advancearrow_forwardUse Matlab to Plot the graph shown in image 2 using data in table on image 1, BMI= W*H Where W is the weight in kilograms and H is the height in meters. Or the four color curves, use the line width ‘3’. To display a BMI of a person use the following: circular MarkSize ‘8’, MarkerEdgeColor ‘cyan’. To display this you have to enter two values. these are the Height in meters and Weight in kilograms. And inform the outcome results to the person from the command window.arrow_forward2. Write a SAS program to read the Admit data set from Mylib, call the new admit data set as Admit temp (in the WORK Library). Use format for displaying data values for the following variables: Sex : M = Male, F = Female Age: Low to 30 =Young , 31 – 50: Middle, 51-High=Senior Date: use DATE9. SAS format. Fee: use Dollar10.2 SAS format.arrow_forward
- Using the MATLAB editor, make a script m-file for the following: The velocity of an object dropped vertically from a height h0 as it falls is given by And that h0 = 32 meters and g = 9.81 m/sec2 For values of h from 32 to 0 meters in increments of 0.25 metersMake variables h0 and g and assign valuesFind the values of v in m/sDisplay the results with headers including unitsWith h in the first column and v in the second columnarrow_forwardWrite the MATLAB commands that assign 33 and 4 to the variables a and b, respectively. Then, create a column vector W with the elements а! In(ab) Vb - a V(a + b)² – (b – a)? -a b where y! is the factorial of y, for which you should use a built-in MATLAB function, and In(x) is the natural logarithm of x. Finally, compute the average of the elements in W.arrow_forward
- Database System ConceptsComputer ScienceISBN:9780078022159Author:Abraham Silberschatz Professor, Henry F. Korth, S. SudarshanPublisher:McGraw-Hill Education
 Starting Out with Python (4th Edition)Computer ScienceISBN:9780134444321Author:Tony GaddisPublisher:PEARSON
 Digital Fundamentals (11th Edition)Computer ScienceISBN:9780132737968Author:Thomas L. FloydPublisher:PEARSON
  C How to Program (8th Edition)Computer ScienceISBN:9780133976892Author:Paul J. Deitel, Harvey DeitelPublisher:PEARSON
 Database Systems: Design, Implementation, & Manag...Computer ScienceISBN:9781337627900Author:Carlos Coronel, Steven MorrisPublisher:Cengage Learning
 Programmable Logic ControllersComputer ScienceISBN:9780073373843Author:Frank D. PetruzellaPublisher:McGraw-Hill Education