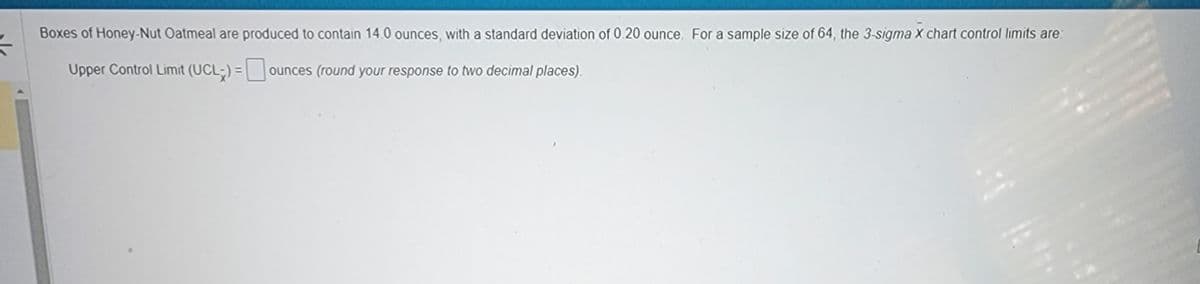
Upper Control Limit (UCL) = ounces (round your response to two decimal places).


Q: The owner of Crackers, Inc. produces both Deluxe (D) and Classic (C) crackers. She only has 4,800…
A: Decision variables: Suppose-D be the no. of boxes of deluxe crackersC be the no. of boxes of…
Q: 1. Reduction of setup time is accomplished by O A. working with external vendors. O B. reducing…
A: In many industrial processes, setting up a machine to move from one output to the next takes the…
Q: Company X is the leading producer of state-of-the-art printers. They have been developing a layout…
A: Organizations are daily getting indulged in their complex operations that bring about a big change…
Q: want to optimize some legacy processes within your organization. How might you go about it?
A: Many service departments use legacy systems, which are those that were created using antiquated…
Q: Construct the Project Network Diagram 2.Find the Expected Duration and Standard Deviation and…
A: The critical path is a method for determining the most efficient way to complete a project. It…
Q: Year Year Forecast (000) 1 2 3 4.00 7.00 5.00 1 5.00 Registrations (000) a) Calculate the forecasted…
A: The exponential smoothing forecast is a form of time series forecasting that is used to predict…
Q: The pucks used by the National Hockey League for ice hockey must weigh between 5.5 and 6.0 ounces.…
A: Quality control is one of the most important aspects of any company. It is necessary to make sure…
Q: A company is planning on launching a new product. It was thinking of launching in June of next year,…
A: Find the Given details below: Given details: High Medium Low Beats the rival 0.6 0.25 0.15…
Q: A telephone call center uses five customer service representatives (CSRs) during the 8:30 a.m. to…
A: Production is the process in which inputs are combined to have the required output. It includes a…
Q: XYZ Corporation operates two plants, each of which has a capacity of 170 units per day. Each day,…
A: Ans) Formula used in excel sheet: Solver Pic:
Q: Who has the lowest productivity? Workers Orders Processed Customer Type Hours Worked Wage/hr:…
A: Productivity per labor $ = output/(labor hours* labor wage per hr)
Q: What factors can affect the selection of manufacturing process of a firm ?
A: Introduction: Process selection is one of the most important decisions in every commercial…
Q: You want to develop a three-sigma R-Chart. You know the average range is 6 based on several samples…
A: A control chart is a graphical representation of data that is used to monitor or improve the…
Q: What upgrades could be made to your products or services to make it better? Explain your answer.
A: The process of making significant product changes that either attract new customers or enhance the…
Q: 12. Lead time for completion of a job is a function of capacity and
A: Lead time refers to the time from receipt of a job till its completion. There are various factors…
Q: QUESTION 12 A restaurant chain is hyper concerned about products in its supply chain that could be…
A: SCM is a strategic approach to integrating supply and demand in the market. It involves several…
Q: Use the following information in a table, about the activities of a project of a textile factory,…
A: Given information is
Q: determine the safety inventory of the Mashburn Rail option if the Onion Shack purchases 240,000 bags…
A: Annual demand = 240000 Number of days in a year = 365 Daily demand = 240000/365 = 657.5342 Total…
Q: 5. Consider the following project network, consisting of 10 activities (A-J) Activity Predecessor(s)…
A: AOA is a project management tool that used to map and schedule the project activities, events or…
Q: a) Draw a decision tree to represent the above problem. b) Determine the optimal decision that…
A: The expected value of sample information is the sum of the values from each branch in the decision…
Q: Problem 20-8 (Algo) Lakeside Bakery bakes fresh pies every morning. The daily demand for its apple…
A: *The question given in the heading is not relevant to the subject, so I have solved the below…
Q: Construct a decision tree of the above situation clearly identifying the decision and chance nodes.…
A: A decision tree is a visual representation of the possible outcomes of a decision, with the…
Q: d Minimization problems ***When using the simplex method, what is the difference between ma
A: The Simplex method is a technique for manually solving linear programming models employing pivot…
Q: 14. With regards to suppliers, lean systems typically require O A. buyer inspection of goods and…
A: Lean manufacturing system indicating the procedures which helps to reduce the wastage in…
Q: The production planner for Fine Coffees, Inc. produces two coffee blends: American (A) and British…
A: The detailed solution is given in Step 2
Q: A medical facility does MRIs for sports Injuries. Occasionally, a test yields inconclusive results…
A: P-chart is a model of control chart which considering the proportionate value for calculating the…
Q: Draw out the below process: Customer places an order, the order is the specified a delivery time…
A: Different steps found in the given process are listed below. Placing an order with a delivery time…
Q: (1) Find an optimal assignment of trucks to routes to minimize the total cost (using the Hungarian…
A: The Assignment Problem is a problem in the field of Operations Management which is defined as…
Q: Do you need to do anything with the fact that he has only $190 in cash with him?
A: Given data is Item Cubic feet Price ($) Weight Resell value ($) Studs 1 0.10 5 0.80 Plywood…
Q: The Carbondale Hospital is considering the purchase of a new ambulance. The decision will rest…
A: 2 year moving average is calculate by the sum of last two year and divided with number of moving…
Q: 6. A business hands out promotional fliers to 15,000 people. It is estimated that of those they…
A: Number of people to whom promotional fliers are handed = 15000 people Percentage of individuals who…
Q: a. Using factors from above table, determine upper and lower control limits for mean and range…
A: A control chart is a statistical tool which helps to identify the process controllability using…
Q: is the movement of products and materials from manufacturing to the point of consumption. A.…
A: A. Material Management:- Material management includes the planning and the execution of the supply…
Q: A crew of mechanics at the Highway Department garage repair vehicles that break down at an average…
A: The given data is as follows: The arrival rate = 3 vehicles per 12 minutes, so for one hour the…
Q: Given the following payoff table (in K million), about a cooking oil producer in Lusaka. The company…
A: Given data is
Q: The "bullwhip effect" is a term that refers to the buildup of inventory in a supply chain resulting…
A: A distribution chain connecting the merchant to the producer is a part of every supply chain. As…
Q: what is the cause and effect diagram and discuss its benefits and application in the project…
A: A cause-effect is a graphic tool used to graphically depict potential explanations for a particular…
Q: a) The average time of Claudine for the operation = minutes (
A: Average time = Sum of recorded times/Number of observations
Q: A project is scheduled to complete in six months duration. There are two activities in the project.…
A: Actual cost of Activity 1 = AC1 = SAR 300,000 Actual cost of Activity 2 = AC2 = SAR 200,000 Planned…
Q: 9. The following information is given for a CPM network: Activity Predecessor Successor Normal Time…
A: A network diagram is visual representation of a project which helps to identify the project duration…
Q: For the activities listed in the table below, draw the time-scaled diagram and mark the critical…
A: In project management, time scaled diagram is made using CPM and Gantt chart. In the Gantt chart,…
Q: An appliance manufacturer wants to contract with a repair shop to handle authorized repairs In…
A: Process capability Ratio (Cpk) is a statistical tool which helps to identify the process capability…
Q: Wellplace Insurance Company processes insurance policy applications in batches of 25. One day, they…
A: Given data: Sample size = 25 No. of batches = 15 batches Total no. of non-conformance = 14
Q: efer to the information above. What is the optimal number of orders per year? a. 200
A: The economic order quantity is the number of units of a product that a buyer needs to order at one…
Q: Which of the following statements is NOT true? O A feasible solution satisfies all constraints. An…
A: Feasible solution in linear programming problem indicating the region which satisfy all constrain…
Q: Answer the following questions based on the Strategy Region graph given below. The objective is to…
A: The expected value of a decision is the sum of all possible values, weighted by the probability of…
Q: The average daily demand and standard deviation of daily demand for a product is 800 and 12…
A: Daily demand = d = 800 units Standard deviation of daily demand = σ = 12 Replenishment lead time = L…
Q: e efficient anc e labor into pa first-class wo ommon purpo
A: The retailer of fast food services worldwide is McDonald's. Every day, the corporation serves more…
Q: Construct a decision tree of the above situation clearly identifying the decision and chance nodes.l…
A: Decision trees are commonly used to predict the expected payoff for a decision. The expected payoff…
Q: Hart Manufacturing makes three products. Each product requires manufacturing operations in three…
A: As per the given instructions, the decision variables are as follows. P1 = Units of product 1…

Step by step
Solved in 4 steps

- 1. Boxes of Honey-Nut Oatmeal are produced to contain 16.0 ounces, with a standard deviation of 0.10 ounce. For a sample size of 64, the 3-sigma x chart control limits are: Part 2 Upper Control Limit (UCLx)= _______ (round your response to two decimal places). Lower Control Limit (LCLx)= _______ (round your response to two decimal places).The overall average on a process you are attemptingto monitor is 50 units. The process population standard deviationis 1.72. Determine the upper and lower control limits for a meanchart, if you choose to use a sample size of 5. PXa) Set z = 3.b) Now set z = 2. How do the control limits change?Can someone please explain to me how to complete 3-sigma control limits (upper and Lower) using Excel? This is the question I am trying to answer: Thirty-five samples of size 7 each were taken from a fertilizer-bag-filling machine at Panos Kouvelis Lifelong Lawn Ltd. The results were: Overall mean = 57.75 lb., Average range R = 1.78 lb.a) For the given sample size, the control limits for 3-sigma x chart are:Upper Control Limit (UCL) = ____Ib (round your response to three decimal places)
- Develop a p chart with 3 sigma control limits and evaluate whether the process is in statical controlThe results of inspection of DNA samples taken over the past 10 days are given below. Sample size is 100. Day 1 2 3 4 5 6 7 8 9 10 Defectives 7 9 9 11 7 8 0 11 13 2 The upper and lower 3-sigma control chart limits are: UCLp = (enter your response as a number between 0 and 1, rounded to three decimal places). LCLp = (enter your response as a number between 0 and 1, rounded to three decimal places).A process considered to be in control measures an ingredient in ounces. A quality inspector took 10 samples, each with 5 observations as follows: SEE ATTACHED PHOTO Using this information, obtain three-sigma (i.e., z=3) control limits for a mean control chart and control limits for a range chart, respectively. It is known from previous experience that the standard deviation ofthe process is 1.36.
- Refer to Table S6.1 - Factors for Computing Control Chart Limits (3 sigma) LOADING... for this problem. Thirty-five samples of size 7 each were taken from a fertilizer-bag-filling machine at Panos Kouvelis Lifelong Lawn Ltd. The results were: Overall mean = 60.75 lb.; Average range R = 1.64 lb. a) For the given sample size, the control limits for 3-sigma x chart are: Upper Control Limit (UCLx) = nothing lb. (round your response to three decimal places).Lower Control Limit (LCLx) = 12.179412.1794 inches (round your response to four decimal places). Part 5 Based on the x-chart, is one or more samples beyond the control limits? No . Part 6 For the given data, the R = enter your response here inches (round your response to four decimal places).Can someone please explain how to find upper and lower limits using Excel? I am trying to answer this question: The overall average on a process you are attempting to monitor is 50.0 units. The process population standard deviation is 1.84 Sample size is given to be 4.a) Determine the 3-sigma x-chart control limits. Upper Control Limit (UCL) = ____units (round your response to two decimal places).
- Refer to Table S6.1 - Factors for Computing Control Chart Limits (3 sigma) LOADING... for this problem. Ross Hopkins is attempting to monitor a filling process that has an overall average of 725 mL. The average range R is 6 mL. For a sample size of 10, the control limits for 3-sigma x chart are: Upper Control Limit (UCLx) = nothing mL (round your response to three decimal places).A process considered to be in control measures an ingredient in ounces. A quality inspector took 10 samples, each with 5 observations as follows: Using this information, obtain three-sigma (i.e., z=3) control limits for a mean control chart and control limits for a range chart, respectively. It is known from previous experience that the standard deviation of the process is 1.36. Discuss whether the process is in control or not.A Quality Analyst wants to construct a control chart for determining whether three machines, all producing the same product, are under control with regard to a particular quality variable. Accordingly, he sampled four units of output from each machine, with the following results : Machine #1 measurements [14, 13, 24, 22]; Machine #2 measurements [ 14, 19, 23, 14]; Machine #3 measurements [ 14, 16, 13, 16]. Using the factors for three sigma control limits, what are x-bar chart upper and lower control limits? a. 24.65and 9.013 b. 22.43and 11.24 c. 18.9and 14.76 d. 39.83and -6.167


