URBAN OUTFITTERS, INC. Consolidated Statements of Income (in thousands, except share and per share data) Fiscal Year Ended January 31, 2019 2018 2017 3,616,014 2,440,507 1,175,507 Net sales 3,950,623 3,545,794 Cost of sales 2,603,911 1,346,712 2,301,181 1,244,613 Gross pro fit Selling, general and administrative expenses Income from operations 965,399 381,313 9,530 1,035 915,615 259,892 906,086 338,527 1,879 2,280 Interest income 4,879 1,435 Other income Other expenses (6,325) 385,553 (4,840) 261,366 153,103 (4,587) 338,099 Income before income taxes Income tax expense 87,550 298,003 119,979 218,120 Net income 108,263 Net income per common share: Basic 2.75 0.97 1.87 Diluted 2.72 0.96 1.86 Weighted-average common shares outstanding: Basic 108,303,594 111,887,308 116,873,023 Diluted 109,706,007 112,367,924 117,291,117 All All January 31І, 2019 January 31І, 2018 ASSETS Current assets: Cash and cash equivalents 358,260 279,232 80,461 370,507 114,296 1,202,756 796,029 282,220 165,125 76,962 351,395 103,055 Marketable securities Accounts receivable, net of allowance for doubtful accounts of $1,499 and $1,326, respectively Inventory Prepaid expenses and other current assets Total current assets 978,757 813,768 58,688 Property and equipment, net Marketable secur 57,292 Deferred income taxes and other assets 104,438 2,160,515 101,567 1,952,780 Total Assets $ LIABILITIES AND SHAREHOLDERS’ EQUITY Current liabilities: Accounts payable Accrued compensation and benefits Accrued expenses and other current liabilities 2$ 128,246 144,414 54,799 187,431 36,058 195,910 360,214 Total current liabilities 386,644 Long-term debt Deferred rent and other liabilities 284,773 291,663 Total Liabilities 671,417 651,877 Commitments and contingencies (see Note 14) Shareholders' equity: Preferred shares; $.0001 par value, 10,000,000 shares authorized, none issued Common shares; $.0001 par value, 200,000,000 shares authorized, 105,642,283 and 108,248,568 shares issued and outstanding, respectively Additional paid-in-capital Retained earnings Accumulated other comprehensive loss Total Shareholders' Equity Total Liabilities and Shareholders' Equity 11 684 1,516,190 1,310,859 (27,103) 1,489,098 2,160,515 (10,651) 1,300,903 1,952,780 $
URBAN OUTFITTERS, INC. Consolidated Statements of Income (in thousands, except share and per share data) Fiscal Year Ended January 31, 2019 2018 2017 3,616,014 2,440,507 1,175,507 Net sales 3,950,623 3,545,794 Cost of sales 2,603,911 1,346,712 2,301,181 1,244,613 Gross pro fit Selling, general and administrative expenses Income from operations 965,399 381,313 9,530 1,035 915,615 259,892 906,086 338,527 1,879 2,280 Interest income 4,879 1,435 Other income Other expenses (6,325) 385,553 (4,840) 261,366 153,103 (4,587) 338,099 Income before income taxes Income tax expense 87,550 298,003 119,979 218,120 Net income 108,263 Net income per common share: Basic 2.75 0.97 1.87 Diluted 2.72 0.96 1.86 Weighted-average common shares outstanding: Basic 108,303,594 111,887,308 116,873,023 Diluted 109,706,007 112,367,924 117,291,117 All All January 31І, 2019 January 31І, 2018 ASSETS Current assets: Cash and cash equivalents 358,260 279,232 80,461 370,507 114,296 1,202,756 796,029 282,220 165,125 76,962 351,395 103,055 Marketable securities Accounts receivable, net of allowance for doubtful accounts of $1,499 and $1,326, respectively Inventory Prepaid expenses and other current assets Total current assets 978,757 813,768 58,688 Property and equipment, net Marketable secur 57,292 Deferred income taxes and other assets 104,438 2,160,515 101,567 1,952,780 Total Assets $ LIABILITIES AND SHAREHOLDERS’ EQUITY Current liabilities: Accounts payable Accrued compensation and benefits Accrued expenses and other current liabilities 2$ 128,246 144,414 54,799 187,431 36,058 195,910 360,214 Total current liabilities 386,644 Long-term debt Deferred rent and other liabilities 284,773 291,663 Total Liabilities 671,417 651,877 Commitments and contingencies (see Note 14) Shareholders' equity: Preferred shares; $.0001 par value, 10,000,000 shares authorized, none issued Common shares; $.0001 par value, 200,000,000 shares authorized, 105,642,283 and 108,248,568 shares issued and outstanding, respectively Additional paid-in-capital Retained earnings Accumulated other comprehensive loss Total Shareholders' Equity Total Liabilities and Shareholders' Equity 11 684 1,516,190 1,310,859 (27,103) 1,489,098 2,160,515 (10,651) 1,300,903 1,952,780 $

Intermediate Accounting: Reporting And Analysis
3rd Edition
ISBN:9781337788281
Author:James M. Wahlen, Jefferson P. Jones, Donald Pagach
Publisher:James M. Wahlen, Jefferson P. Jones, Donald Pagach
Chapter5: The Income Statement And The Statement Of Cash Flows
Section: Chapter Questions
Problem 1E

Related questions
Question
Practice Pack
Find earnings per share 2019
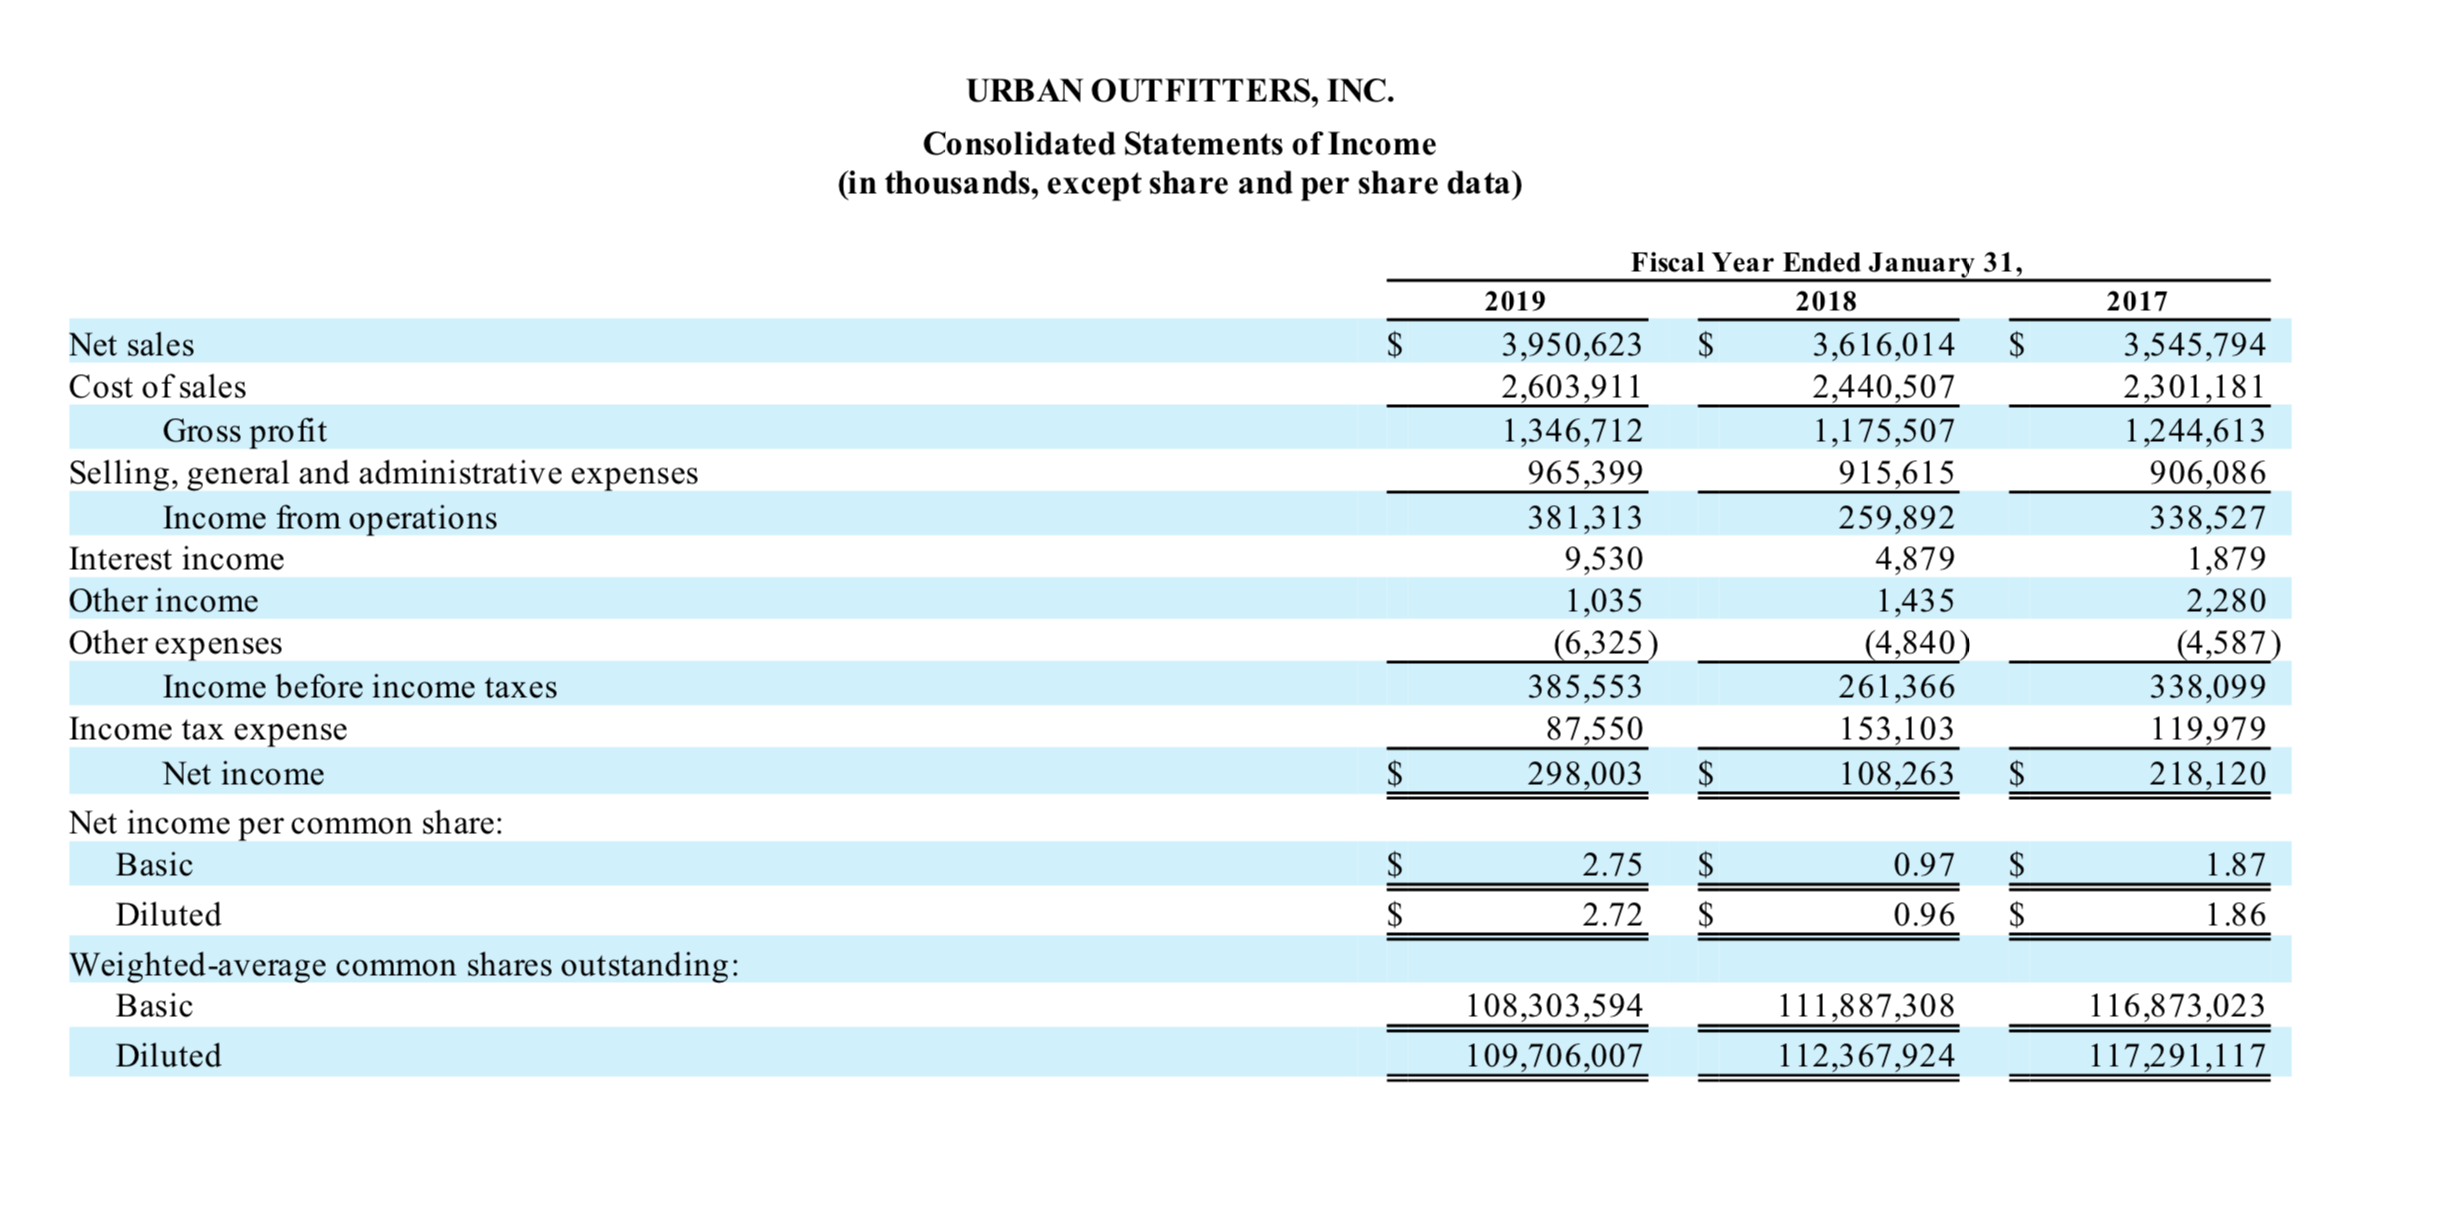
Transcribed Image Text:URBAN OUTFITTERS, INC.
Consolidated Statements of Income
(in thousands, except share and per share data)
Fiscal Year Ended January 31,
2019
2018
2017
3,616,014
2,440,507
1,175,507
Net sales
3,950,623
3,545,794
Cost of sales
2,603,911
1,346,712
2,301,181
1,244,613
Gross pro fit
Selling, general and administrative expenses
Income from operations
965,399
381,313
9,530
1,035
915,615
259,892
906,086
338,527
1,879
2,280
Interest income
4,879
1,435
Other income
Other expenses
(6,325)
385,553
(4,840)
261,366
153,103
(4,587)
338,099
Income before income taxes
Income tax expense
87,550
298,003
119,979
218,120
Net income
108,263
Net income per common share:
Basic
2.75
0.97
1.87
Diluted
2.72
0.96
1.86
Weighted-average common shares outstanding:
Basic
108,303,594
111,887,308
116,873,023
Diluted
109,706,007
112,367,924
117,291,117
All All
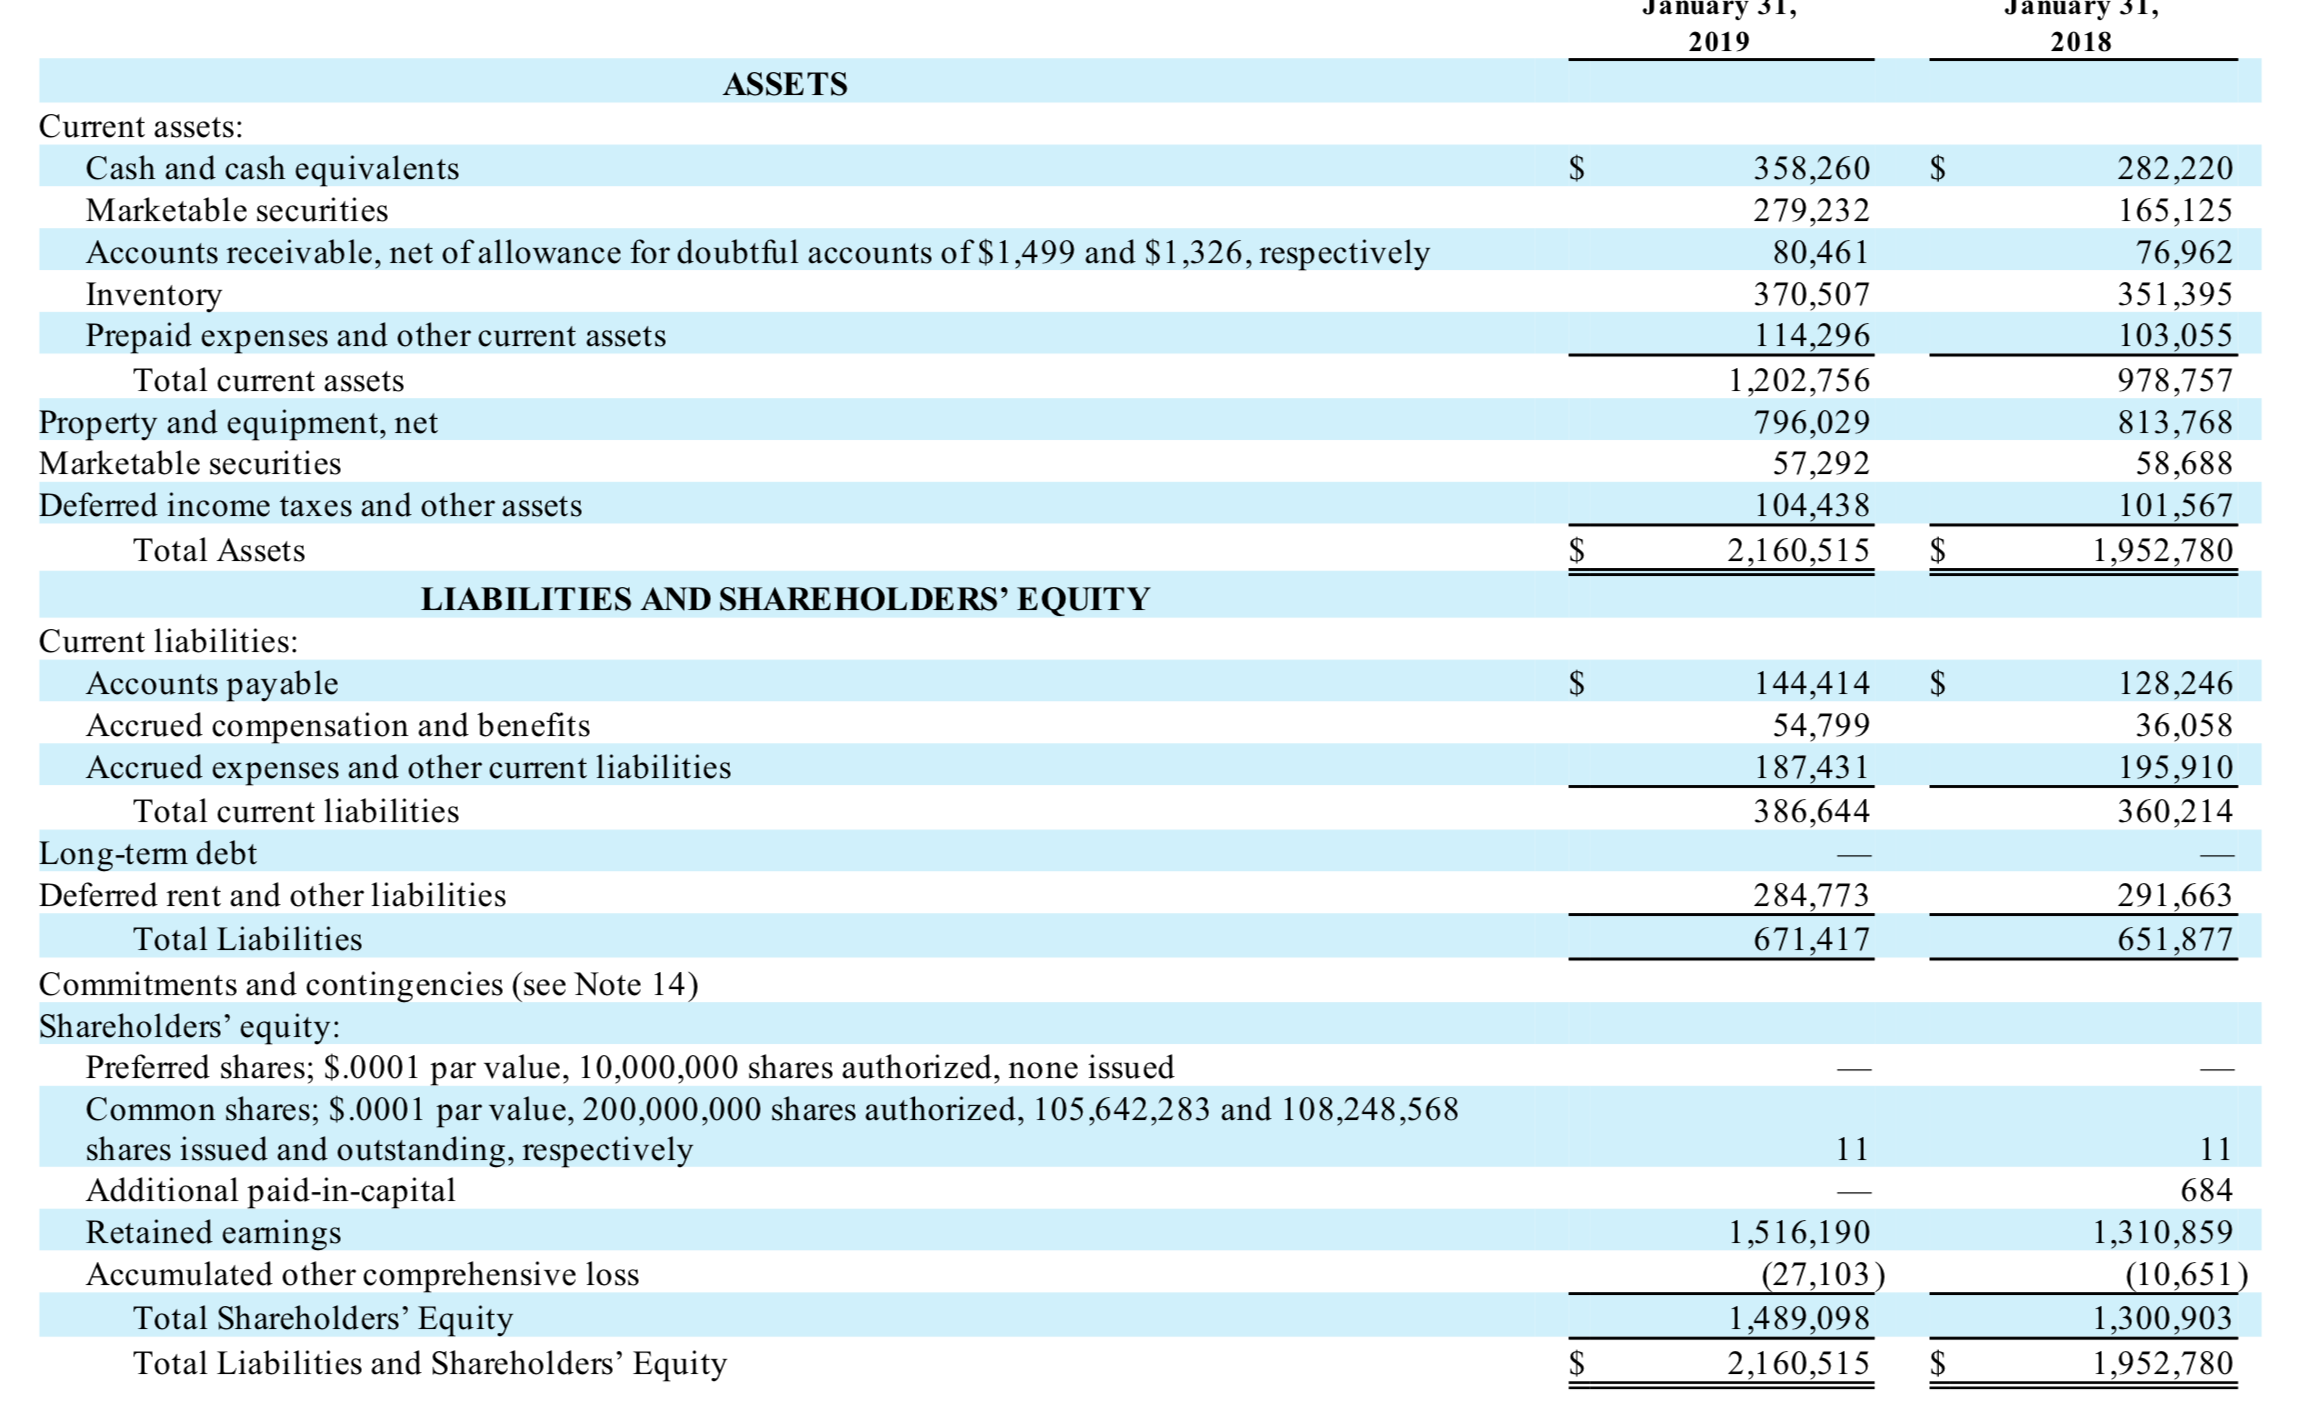
Transcribed Image Text:January 31І,
2019
January 31І,
2018
ASSETS
Current assets:
Cash and cash equivalents
358,260
279,232
80,461
370,507
114,296
1,202,756
796,029
282,220
165,125
76,962
351,395
103,055
Marketable securities
Accounts receivable, net of allowance for doubtful accounts of $1,499 and $1,326, respectively
Inventory
Prepaid expenses and other current assets
Total current assets
978,757
813,768
58,688
Property and equipment, net
Marketable secur
57,292
Deferred income taxes and other assets
104,438
2,160,515
101,567
1,952,780
Total Assets
$
LIABILITIES AND SHAREHOLDERS’ EQUITY
Current liabilities:
Accounts payable
Accrued compensation and benefits
Accrued expenses and other current liabilities
2$
128,246
144,414
54,799
187,431
36,058
195,910
360,214
Total current liabilities
386,644
Long-term debt
Deferred rent and other liabilities
284,773
291,663
Total Liabilities
671,417
651,877
Commitments and contingencies (see Note 14)
Shareholders' equity:
Preferred shares; $.0001 par value, 10,000,000 shares authorized, none issued
Common shares; $.0001 par value, 200,000,000 shares authorized, 105,642,283 and 108,248,568
shares issued and outstanding, respectively
Additional paid-in-capital
Retained earnings
Accumulated other comprehensive loss
Total Shareholders' Equity
Total Liabilities and Shareholders' Equity
11
684
1,516,190
1,310,859
(27,103)
1,489,098
2,160,515
(10,651)
1,300,903
1,952,780
$
Expert Solution
This question has been solved!
Explore an expertly crafted, step-by-step solution for a thorough understanding of key concepts.

This is a popular solution!

Includes step-by-step video

Trending now
This is a popular solution!

Learn your way
Includes step-by-step video

Step by step
Solved in 2 steps with 2 images

Knowledge Booster


Learn more about
Need a deep-dive on the concept behind this application? Look no further. Learn more about this topic, accounting and related others by exploring similar questions and additional content below.Recommended textbooks for you
Intermediate Accounting: Reporting And Analysis
Accounting
ISBN:
9781337788281
Author:
James M. Wahlen, Jefferson P. Jones, Donald Pagach
Publisher:
Cengage Learning

Principles of Accounting Volume 1
Accounting
ISBN:
9781947172685
Author:
OpenStax
Publisher:
OpenStax College
Intermediate Accounting: Reporting And Analysis
Accounting
ISBN:
9781337788281
Author:
James M. Wahlen, Jefferson P. Jones, Donald Pagach
Publisher:
Cengage Learning
Principles of Accounting Volume 1
Accounting
ISBN:
9781947172685
Author:
OpenStax
Publisher:
OpenStax College

Financial Accounting: The Impact on Decision Make…
Accounting
ISBN:
9781305654174
Author:
Gary A. Porter, Curtis L. Norton
Publisher:
Cengage Learning

Cornerstones of Financial Accounting
Accounting
ISBN:
9781337690881
Author:
Jay Rich, Jeff Jones
Publisher:
Cengage Learning

Survey of Accounting (Accounting I)
Accounting
ISBN:
9781305961883
Author:
Carl Warren
Publisher:
Cengage Learning