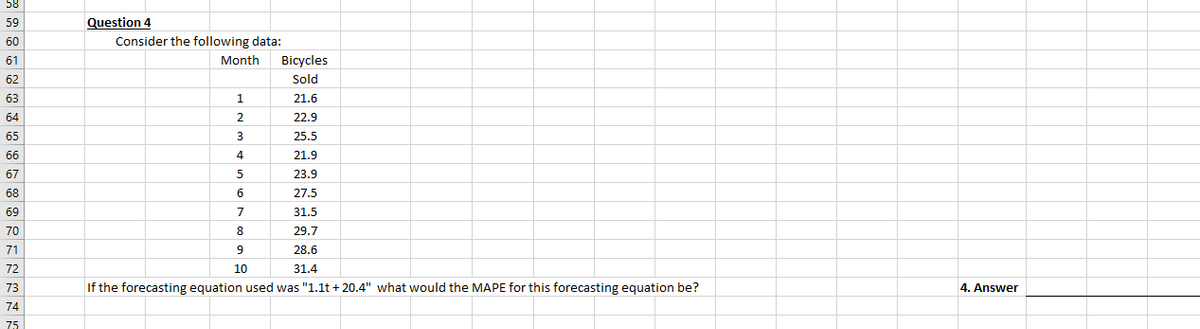
Question 4 Consider the following data: Month Bicycles Sold 21.6 2. 22.9 25.5 21.9 23.9 6. 27.5 7 31.5 8 29.7 9 28.6 10 31.4 If the forecasting equation used was "1.1t + 20.4" what would the MAPE for this forecasting equation be? 4. Answer


Q: Slope, b1 = MSE= c. What is the forecast for t = 8? If required, round your answer to three decimal…
A: *Answer: *b Here, the sample size is n = 7. Now, obtain the following table for necessary…
Q: Comprehensively state the criteria and process of selecting appropriate models for time series…
A: Time series forecasting is used when making scientific forecasts based on historical time stamped…
Q: What is a qualitative forecasting model, and when is its use appropriate?
A: Forecasting refers to making predictions based on past and present data and analyzing the trends.…
Q: Jan '20 0.68 Feb '20 0.76 Mar '20 1.6 Apr '20 1.47 May '20 0.98 Jun '20 1.18 Jul '20 3.59 Aug '20…
A: 1) Simple Moving Average (SMA): A simple moving average is a statistical tool that simply calculates…
Q: Below is a table containing data on product demand for the most recent three months along with the…
A: MSE stands for mean squared error which is used to estimate how close a regression line to a set of…
Q: Actual sales of TV's for the first six month in 2021 were as follows: January 60…
A: A simple moving average (SMA) calculates the average of a selected range of prices, usually closing…
Q: Consider the following demand data. Penod 2. 3. 4. 6. 6. 10 demand 130 452 428 470 478 Use Holt's…
A: The forecast can be calculated by the below formula: Ft+1= Dt+Dt-1+Dt-2/3 F = Forecast D = Demand F…
Q: temperature. (ii) Predict the electricity consumption of the office when the maximum temperature is…
A: Regression is a measurable technique utilized in money, contributing, and different disciplines that…
Q: Two different forecasting techniques (F1 and F2) were used to forecast demand for cases of bottled…
A:
Q: Campus Advising needs to allocate time this week for office appointments, so she needs te forecast…
A: Economics is a branch of social science that describes and analyzes the behaviors and decisions…
Q: You own a restaurant near the beach. Business has been growing each year, but obviously spikes…
A: The regression equation gives a mathematical form to the association or link between two or more…
Q: What factor(s) determine the magnitude of the LM slope (steep or flat)?
A: The factor that determine the magnitude of the LM curve, i.e. whether it will be steep or flat…
Q: Name two coincident indicators used in forecasting
A: Coincident indicators help in understanding the current economic position prevailing in a particular…
Q: Which of the following is NOT TRUE about trend analysis? a) In trend analysis every item is…
A: Economics as a subject deals with the allocation of scarce resources among humans with unlimited…
Q: Choose one of the following forecasting methods discussed in this chapter: last-value, averaging,…
A: Exponential smoothing is commonly used to make short term forecasts, yet longer-term estimates…
Q: I Consider the demand for trading cards listed below. Month Demand Jan. 51,000 Feb. 48,000 March…
A: Take months in numerical terms like January for 1 February for 2
Q: Identify and briefly describe the two general forecasting approaches.
A: Qualitative forecasting is predicated on information that cannot be measured. It's especially…
Q: The following table represents sales data for milk (in hundred liters) sold by a grocery. Do the…
A: By observation we can use Weighted moving average with weights of 0.1,0.3,0.6 for forecasting…
Q: onential Smoothing with the following parameters: Ft+1=32 and the α = .15 Regression Months 1 2 3 4…
A: *Answer: . Forecasts are useful tools for making predictions and analyzing future outcomes.…
Q: MARCH ? ?
A: Forecasting refers to the method of predicting an outcome. It is used to adjust inventory levels in…
Q: Consider the following time series data: Month 1 2 3 4 5 6 7 Value 24 13 20 12 19 23…
A: MSE stands for Mean squared error. It calculates the average squared difference between the forecast…
Q: Two coincident indicators used in forecasting
A: A coincident pointer is a metric that shows the present status of financial movement inside a…
Q: Director Very Busy needs to allocate time this week for office appointments, so he needs to forecast…
A: Economics is a branch of social science that describes and analyzes the behaviors and decisions…
Q: forecasts? 7. Contrast the use of MAD and MSE in evaluating forecasts. 8. What advantages as a…
A: 7. Introduction MAD (Mean Absolute Deviation) is a measure of variability which measures how far…
Q: Here are the errors associated with a particular forecast over the past five months, in…
A: Economics is a branch of social science that describes and analyzes the behaviors and decisions…
Q: Title Value Gross Private Domestic Investment $3,134.201 billion Private Nonresidential Fixed…
A: "Inventory investment is the difference between gross private domestic investment and fixed private…
Q: The quadrant on which IS and LM are plotted is known as IY space? true or false
A: IS line shows the goods market equilibrium and it is downward sloping curve which shows Inverse…
Q: The forecast with out seasonality is modeled as: Sales 6 t+ 236.00, where t= time in months,…
A: Seasonality refers to a pattern which is repetitive in a time series data. It repeats over a period…
Q: 1. Identify a company of your choice in Oman and write a brief detail about the company including…
A: A company of my choice will be Raysut Cement Company SAOG situated in Oman. Further will be…
Q: Next Stândard Period Error Forecasting Method Used Forecast (MSE) 1.3-period UnWMA 10.42 3.24…
A: Given:
Q: c. What would be this week's forecast for employee appointments using exponential smoothing with…
A: Economics is a branch of social science that describes and analyzes the behaviors and decisions…
Q: A firm experienced the demand shown in the following table. Fill in the table by preparing forecasts…
A: Compute 5-year moving average demand forecast using Fy = (Dy-1 + Dy-2 + Dy-3 + Dy-4 + Dy-5) / 5…
Q: Suppose you have an extra six months of data on demands and prices, in addition to the data in the…
A: Given:
Q: 4. Relate cycles, seasonality and trends in time series forecasting. What is their relevance in such…
A: Note:- Dear learner you have posted two questions, as per our policy we will solve only first…
Q: .Why does a business cycle diagram serve as a forecasting model? 2.Name TWO coincident indicators…
A: Business cycles are a factor in which the assessment of the overall performance of the economy…
Q: A researcher has a sample of 6 annual observations {94, 104, 102, 99, 111 and 107} for the CPI in…
A: The Consumer Price Index is a weighted average of expenses for a basket of goods and services, such…
Q: Suppose we have the following time series data on variable Y (where t = trend): t Y 1 100 2 120 3…
A: Given: t y (At) 1 100 2 120 3 160 4 200 α=0.5
Q: The demand of a product of a company is given below for the past periods. Can we use Winter method…
A: Demand: Demand refers to the willingness to buy a commodity at a particular time and at a particular…
Q: Assume the following AR(1) Y, = 0.036 + 0.69Y,-1 + E Suppose you have data for t-1, let's say Y,I =…
A: * SOLUTION :- *(8)
Q: 12. Calculate a 7-months moving average for each month. What is the forecast for month 11? Months…
A: To Find: 7 months moving average for each month Formula using 7-month moving average…
Q: The demand of a product of a company is given below for the past periods. Can we use Winter method…
A: No, we cannot use winter's model to find the forecast here because of the missing information…
Q: This is a Business Forecasting Question. I know the 3 stages for the evolution of forecasting are 1.…
A: As you have asked above the answer of your question is below.
Q: Which of the following is true about ARIMA models A. ARIMA models cannot be used for seasonal data…
A: ARIMA stands for Auto-Regressive Integrated Moving Average. The lags of the stationary series in…
Q: Qualitative methods of forecasting include:a) sales force composite. b) jury of executive opinion.c)…
A: The methods of sales forecasting include qualitative and quantitative methods. Some of the…
Q: The following is the data of recent refrigerator sales at a local Home Depot store. Month 1 2 3…
A: Weighted moving averages assign a heavier weighting to more current data points since they are more…
Q: Based on the information in the following table, use the Exponential Smoothing Approach (a =0.5) to…
A: Use the below formula: Ft+1=αDt + 1 + αFt Ft+1=forecast for next period Dt=actual demand for…
econometrics


Trending now
This is a popular solution!

Step by step
Solved in 2 steps


- A firm experienced the demand shown in the following table. *Unkown future value to be forecast Fill in the table by preparing forecasts based on a five-year moving average, a three-year moving average, and exponential smoothing (with a w=0.9 and a w=0.3). Note The exponential smoothing forecasts may be begun by assuming Y t+1=Yt. Using the forecasts from 2005 through 2009, compare the accuracy of each of the forecasting methods based on the RMSE criterion. Which forecast would you have used for 2010? Why?The Questor Corporation has experienced the following sales pattern over a 10-year period: Compute the equation of a trend line (similar to Equation 5.4) for these sales data to forecast sales for the next year. (Let 2004=0,2005=1, etc., for the time variable.) What does this equation forecast for sales in the year 2014? Use a first-order exponential smoothing model with a w of 0.9 to forecast sales for the year 2014.Savings-Mart (a chain of discount department stores) sells patio and lawn furniture. Sales are seasonal, with higher sales during the spring and summer quarters and lower sales during the fall and winter quarters. The company developed the following quarterly sales forecasting model: Y t=8.25+0.125t2.75D1t+3.50D3t where Y t=predictedsales(million)inquartert 8.25=quarterlysales(million)whent=0 t=timeperiod(quarter)wherethefourthquarterof2002=0,firstquarterof2003=1,secondquarterof2003=2,... D1t={1forfirst-quarterobservations0otherwiseD2t={1forsecond-quarterobservations0otherwiseD3t={1forthird-quarterobservations0otherwise Forecast Savings-Marts sales of patio and lawn furniture for each quarter of 2010.
- Metropolitan Hospital has estimated its average monthly bed needs as N=1,000+9X where X=timeperiod(months);January2002=0 N=monthlybedneeds Assume that no new hospital additions are expected in the area in the foreseeable future. The following monthly seasonal adjustment factors have been estimated, using data from the past five years: Forecast Metropolitans bed demand for January, April, July, November, and December 2007. If the following actual and forecast values for June bed demands have been recorded, what seasonal adjustment factor would you recommend be used in making future June forecasts?Based on annual data from 2000-2010, the Gadget Company estimates that sales are growing according to a linear trend: Q = 50,000 + 200t where t is time and t = 0 in 2000. a. Forecast sales for 2013. b. Do you see any problems with this forecasting method?Historical demand for Peeps is as displayed in the table. Month Demand January 11 February 18 March 31 April 39 May 44 June 53 July 67 August 82 September 96 Develop forecasts from June through October using these techniques: Holt's method with alpha=0.2 and beta=0.1. For Holt's model, the level and trend for May are assumed to be 44 and 12. Judge which forecast method is the best based on MAD.
- Consider the following time series data: Month 1 2 3 4 5 6 7 Value 24 13 20 12 19 23 15 Compute MSE using the most recent value as the forecast for the next period. What is the forecast for month 8? Compute MSE using the average of all the data available as the forecast for the next period. What is the forecast for month 8? Which method appears to provide the better forecast?Suppose that you work for a U.S. senator who is contemplating writing a bill that would put a national sales tax in place. Because the tax would be levied on the sales revenue of retail stores, the senator has asked you to prepare a forecast of retail store sales for year 8, based on data from year 1 through year 7. The data are: (c1p2) Year Retail Store Sales 1 $1,225 2 1,285 3 1,359 4 1,392 5 1,443 6 1,474 7 1,467 54 Chapter One a. Use the first naive forecasting model presented in this chapter to prepare a forecast of retail store sales for each year from 2 through 8. b. Prepare a time-series graph of the actual and forecast values of retail store sales for the entire period. (You will not have a forecast for year 1 or an actual value for year 8.) c. Calculate the root-mean-squared error for your forecast series using the values for year 2 through year 7. 3. Use the second naive forecasting model presented in this chapter to answer parts (a) through (c) of Exercise 2. Use P 0.2 in…The use of quarterly data to develop the forecasting model Yt = a +bYt-1 is an example of which forecasting technique?
- A researcher has a sample of 6 annual observations {94, 104, 102, 99, 111 and 107} for the CPI in country Z for the period 2015 to 2020, and wants to forecast CPI for the years 2021, 2022 and 2023. The researcher uses 3 different forecasting models: A, B and C. Model A is an AR(1) model with no drift and with an estimated autoregressive coefficient = 0.7. Model B is a MA(1) model with no constant and with an estimated MA coefficient = -0.4 (note the minus !). Model C is a random walk model with no drift. The error terms over the 2015-2020 period were estimated to have the values: {3, -1, 2, 4, -3, 1}. a. Compute the 2021, 2022 and 2023 forecasted values for the consumer price index based on the three models. Show the formulas and the details of your calculations, and explain all the related symbols. b. Suppose that the actual values of the CPI over the 2021, 2022 and 2023 were {108, 114, 105}. Calculate the Root mean square error of the three model forecasts over the 2021-2023…Define Forecasts and forecast errors in time series anaylsis?The following table shows the sales volumes for company XYZ in millions of KES. Use the belowinformation to forecast the sales volumes in in 2022, 2023, 2024. 2026.Year2012203320142015201620172018201920202021Sales 220024003200450055009000150010800163009500 Note:- Do not provide handwritten solution. Maintain accuracy and quality in your answer. Take care of plagiarism. Answer completely. You will get up vote for sure.