A First Course in Probability (10th Edition)
10th Edition
ISBN: 9780134753119
Author: Sheldon Ross
Publisher: PEARSON
expand_more
expand_more
format_list_bulleted
Concept explainers
Question
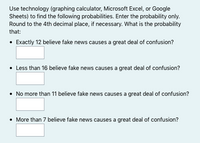
According to Pew Research, 64% of American believe that fake news causes a great deal of confusion.Twenty Americans are selected at random.

Transcribed Image Text:Use technology (graphing calculator, Microsoft Excel, or Google
Sheets) to find the following probabilities. Enter the probability only.
Round to the 4th decimal place, if necessary. What is the probability
that:
• Exactly 12 believe fake news causes a great deal of confusion?
• Less than 16 believe fake news causes a great deal of confusion?
• No more than 11 believe fake news causes a great deal of confusion?
• More than 7 believe fake news causes a great deal of confusion?
Expert Solution
This question has been solved!
Explore an expertly crafted, step-by-step solution for a thorough understanding of key concepts.
This is a popular solution
Trending nowThis is a popular solution!
Step by stepSolved in 2 steps with 1 images

Knowledge Booster
Learn more about
Need a deep-dive on the concept behind this application? Look no further. Learn more about this topic, probability and related others by exploring similar questions and additional content below.Similar questions
- A poll in Canada states that 67% of all respondents favor imposing the death penalty. The poll was considered accurate within 4.7 percentage points 95% of the time. How large was the sample size? Round up to the nearest whole number.arrow_forwarddetermine whether there is a potential for bias and explain why? A poster for the U.S.Deparment of Labor surveys 1500 randomly selected adults about their employment status.arrow_forwardDescribe a method for getting a fair and unbiased simple random sample of 12 people if you have a group of 200 people to choose from.arrow_forward
- A political campaign wants to estimate the number of adult residents who voted in the last city election. Answer the following. (a) Which of the following surveys probably would best represent the entire adult population of the city? 50 senior residents are randomly selected; 42 voted in the last election. 50 adult residents are randomly selected from the city; 25 voted in the last election. 50 business owners are randomly selected; 38 voted in the last election. (b) There are 16,800 adults who live in the city. Using your answer from part (a), estimate the number of adults who voted in the last city election. adultsarrow_forwardAbout 4% of the population has a particular genetic mutation. 600 people are randomly selected. Find the mean for the number of people with the genetic mutation in such groups of 600. Submit Question acerarrow_forwardExplain in detail RANDOM ASSIGNMENT OF SUBJECTS.arrow_forward
- There are 15 numbers on a list, and the smallest number is changed from 4 to 0.4.a) Is it possible to determine by how much the mean changes? If so, by how much does it change?b) Is it possible to determine the value of the mean after the change? If so, what is the value?c) Is it possible to determine by how much the median changes? If so, by how much does it change?d) Is it possible to determine by how much the standard deviation changes? If so, by how much does it changearrow_forward7. Wondering if there is a connection between a person's height and the number of tattoos they have, Mac asks 50 people how tall they are and how many tattoos they have. What type of study was used? a. Experimental b. Observationalarrow_forwardIn a series of studies, Sebastian Deri and his colleagues (2017) asked multiple groups about the number of friend groups they had and how often they attended different social events. They then asked participants how they thought their own numbers compared to other people's: Did participants see themselves as less social, the same as, or more social than others? In the first study, the researchers reported that: "Three hundred four participants from Amazon's Mechanical Turk (150 women; Mage = 37.1; 78% White, 10% Black, and 6% Asian) completed a survey in exchange for modest payment" (p. 860). What do the researchers mean by "Amazon's Mechanical Turk" with respect to their sample of participants? O A. An archival data set that already exists and from which researchers can use data O B. An online tool that researchers can use to recruit people to participate in research in exchange for a small payment O C. An e-book sold by Amazon that includes contact information for possible…arrow_forward
- Fortune publishes data on sales, profits, assets, stockholders' equity, market value, and earnings per share for the 500 largest U.S. industrial corporations every year. Assume that you want to select a simple random sample of 10 corporations from the Fortune 500 list. Use the last three digits in column 10 of the table of random numbers, beginning with 945. Read down the column and identify the numbers of the 10 corporations that would be selected. (Enter your answers as a comma-separated list.)arrow_forwardIn 1993 approximately 62.1 million Americans suffered injuries, as reported by the National Center for Health Statistics in Vital and Health Statistics. More males (33.4 million) were injured than females (28.7 million). Those statistics do not tell us whether males and females tend to be injured in similar circumstances. One set of categories commonly used for accident circumstances. One set of categories commonly used for accident circumstance is "while at work," "home", "motor vehicle", and "other". A random sample of accident reports gave the data in contingency table below. Male Female While at work 19 24 27 Home 14 Motor Vehicle 26 Other At the 5% significance level, do the data provide sufficient evidence to conclude that an association exists between accident circumstances and sex? Type in Canvas the grand total. 35arrow_forward
arrow_back_ios
arrow_forward_ios
Recommended textbooks for you
 A First Course in Probability (10th Edition)ProbabilityISBN:9780134753119Author:Sheldon RossPublisher:PEARSON

A First Course in Probability (10th Edition)
Probability
ISBN:9780134753119
Author:Sheldon Ross
Publisher:PEARSON
