Use the data in the table below for Questions A - G. Remember to show ALL your work. A researcher performs a study investigating differences in perceived stress during the COVID-19 pandemic in undergraduate students. She measures levels of depression in a group of 7 first year undergraduates as well as in a group of 7 fourth year undergraduates using a continuous variable scale. The data are presented in the following table: First Year Fourth Year (X) 4 (Y) 6. 6. 3 10 10 8 10 4 2 A. Calculate the mean for the first year group and the mode for the fourth year group В. In general, what is the purpose of obtaining a measure of central tendency? C. Calculate the range for the first year group. Describe one advantage and one disadvantage of the range as a measure of variability. D. Calculate the variance for each of the two separate groups Е. Calculate the standard deviation for each of the two separate groups F. Previous studies have shown that first years tend to have perceived levels of stress that are more similar to one another than fourth years do. Do the current data agree with this finding? Explain your answer. G. In general, how do calculations for variance and standard deviation for samples differ from those for population variance and standard deviation? Explain why.
Use the data in the table below for Questions A - G. Remember to show ALL your work. A researcher performs a study investigating differences in perceived stress during the COVID-19 pandemic in undergraduate students. She measures levels of depression in a group of 7 first year undergraduates as well as in a group of 7 fourth year undergraduates using a continuous variable scale. The data are presented in the following table: First Year Fourth Year (X) 4 (Y) 6. 6. 3 10 10 8 10 4 2 A. Calculate the mean for the first year group and the mode for the fourth year group В. In general, what is the purpose of obtaining a measure of central tendency? C. Calculate the range for the first year group. Describe one advantage and one disadvantage of the range as a measure of variability. D. Calculate the variance for each of the two separate groups Е. Calculate the standard deviation for each of the two separate groups F. Previous studies have shown that first years tend to have perceived levels of stress that are more similar to one another than fourth years do. Do the current data agree with this finding? Explain your answer. G. In general, how do calculations for variance and standard deviation for samples differ from those for population variance and standard deviation? Explain why.

Algebra & Trigonometry with Analytic Geometry
13th Edition
ISBN:9781133382119
Author:Swokowski
Publisher:Swokowski
Chapter7: Analytic Trigonometry
Section7.6: The Inverse Trigonometric Functions
Problem 94E

Related questions

Question
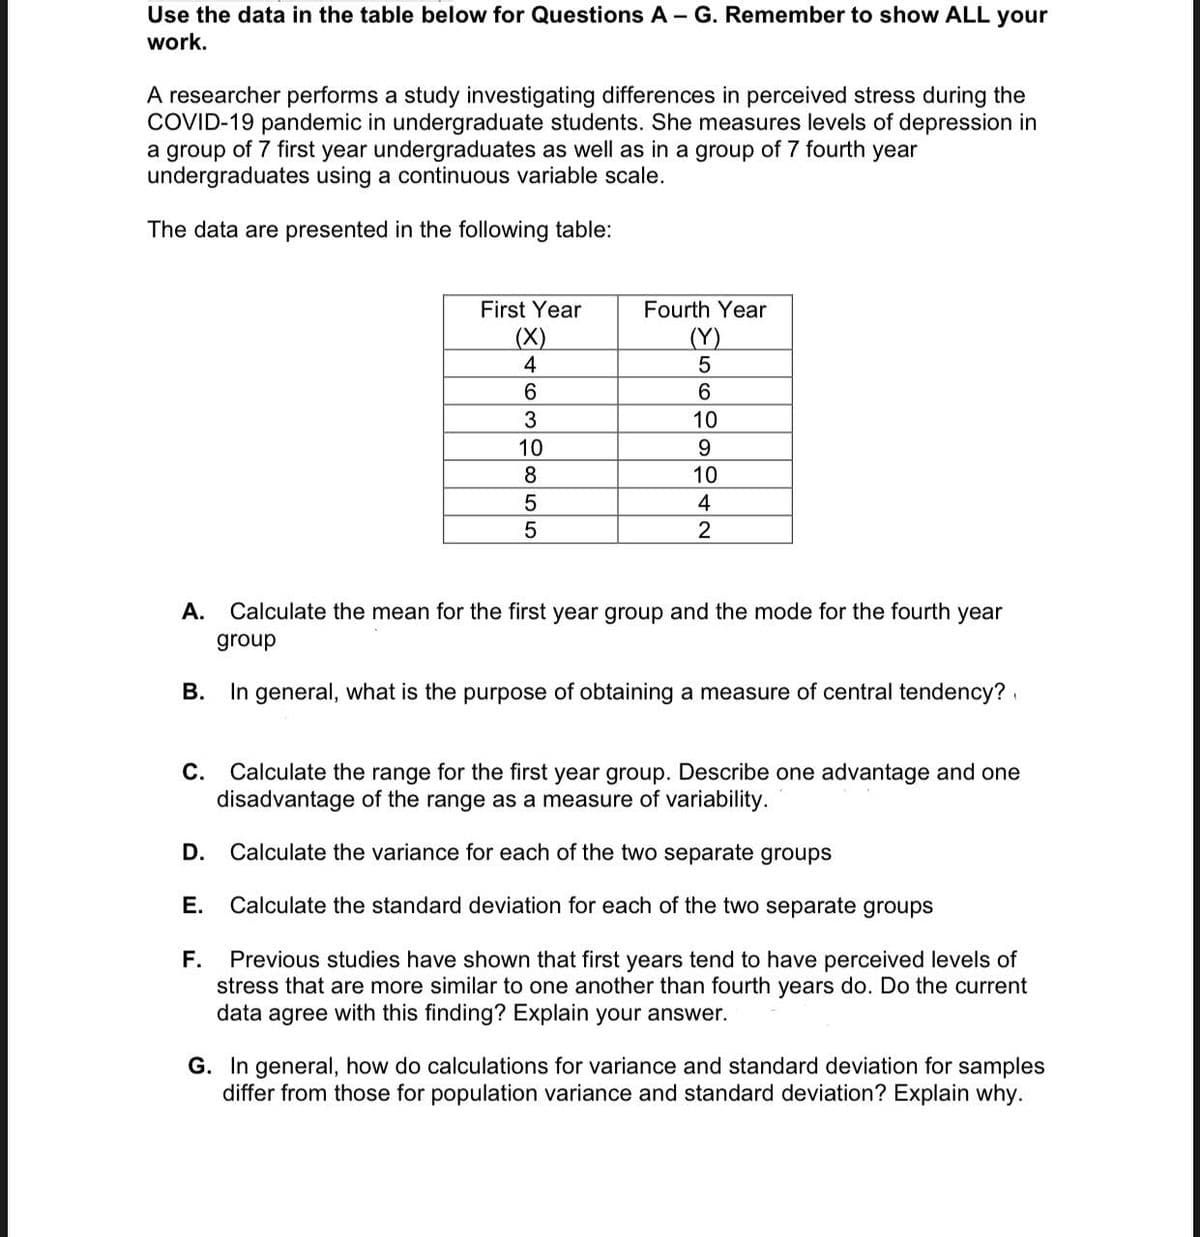
Transcribed Image Text:Use the data in the table below for Questions A - G. Remember to show ALL your
work.
A researcher performs a study investigating differences in perceived stress during the
COVID-19 pandemic in undergraduate students. She measures levels of depression in
a group of 7 first year undergraduates as well as in a group of 7 fourth year
undergraduates using a continuous variable scale.
The data are presented in the following table:
First Year
Fourth Year
(X)
(Y)
4
6.
10
10
9.
8
10
4
2
A.
Calculate the mean for the first year group and the mode for the fourth year
group
В.
In general, what is the purpose of obtaining a measure of central tendency?
Calculate the range for the first year group. Describe one advantage and one
disadvantage of the range as a measure of variability.
С.
D. Calculate the variance for each of the two separate groups
Е.
Calculate the standard deviation for each of the two separate groups
F.
Previous studies have shown that first years tend to have perceived levels of
stress that are more similar to one another than fourth years do. Do the current
data agree with this finding? Explain your answer.
G. In general, how do calculations for variance and standard deviation for samples
differ from those for population variance and standard deviation? Explain why.
639o55
Expert Solution
This question has been solved!
Explore an expertly crafted, step-by-step solution for a thorough understanding of key concepts.

Step by step
Solved in 3 steps with 2 images

Knowledge Booster


Learn more about
Need a deep-dive on the concept behind this application? Look no further. Learn more about this topic, statistics and related others by exploring similar questions and additional content below.Recommended textbooks for you
Algebra & Trigonometry with Analytic Geometry
Algebra
ISBN:
9781133382119
Author:
Swokowski
Publisher:
Cengage

Glencoe Algebra 1, Student Edition, 9780079039897…
Algebra
ISBN:
9780079039897
Author:
Carter
Publisher:
McGraw Hill

Functions and Change: A Modeling Approach to Coll…
Algebra
ISBN:
9781337111348
Author:
Bruce Crauder, Benny Evans, Alan Noell
Publisher:
Cengage Learning
Algebra & Trigonometry with Analytic Geometry
Algebra
ISBN:
9781133382119
Author:
Swokowski
Publisher:
Cengage
Glencoe Algebra 1, Student Edition, 9780079039897…
Algebra
ISBN:
9780079039897
Author:
Carter
Publisher:
McGraw Hill
Functions and Change: A Modeling Approach to Coll…
Algebra
ISBN:
9781337111348
Author:
Bruce Crauder, Benny Evans, Alan Noell
Publisher:
Cengage Learning