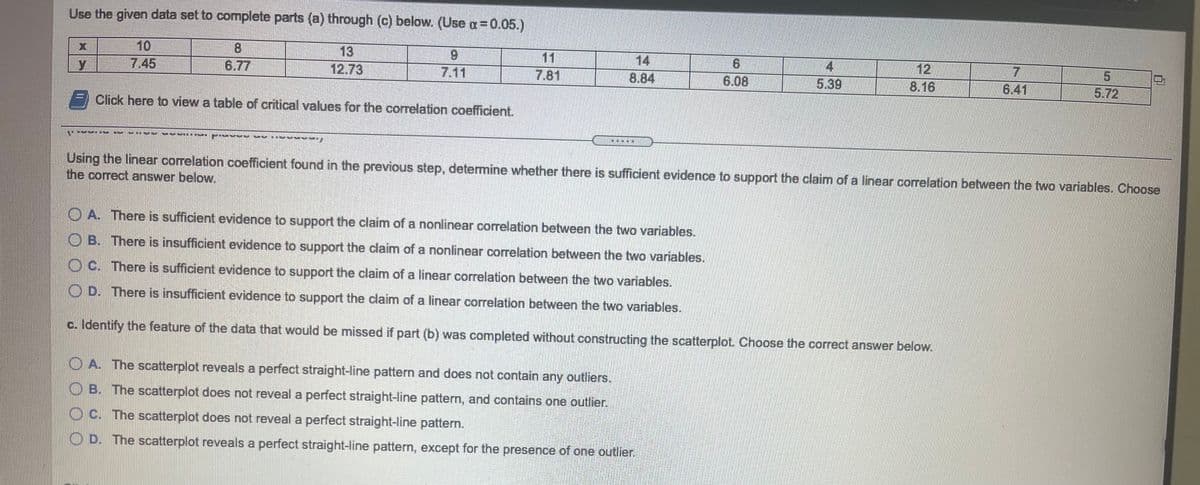
Use the given data set to complete parts (a) through (c) below. (Use a=0.05.) 10 13 12.73 11 7.81 y 7.45 6.77 14 6. 4. 12 8.16 7.11 8.84 6.08 5.39 6.41 5.72 Click here to view a table of critical values for the correlation coefficient. Using the linear correlation coefficient found in the previous step, determine whether there is sufficient evidence to support the claim of a linear correlation between the two variables. Choose the correct answer below. O A. There is sufficient evidence to support the claim of a nonlinear corelation between the two variables. O B. There is insufficient evidence to support the claim of a nonlinear correlation between the two variables. O C. There is sufficient evidence to support the claim of a linear correlation between the two variables. O D. There is insufficient evidence to support the claim of a linear correlation between the two variables. c. Identify the feature of the data that would be missed if part (b) was completed without constructing the scatterplot. Choose the correct answer below. O A. The scatterplot reveals a perfect straight-line pattern and does not contain any outliers. O B. The scatterplot does not reveal a perfect straight-line pattern, and contains one outlier. O C. The scatterplot does not reveal a perfect straight-line pattern. O D. The scatterplot reveals a perfect straight-line pattern, except for the presence of one outlier.

Big Ideas Math A Bridge To Success Algebra 1: Student Edition 2015
1st Edition
ISBN:9781680331141
Author:HOUGHTON MIFFLIN HARCOURT
Publisher:HOUGHTON MIFFLIN HARCOURT
Chapter4: Writing Linear Equations
Section: Chapter Questions
Problem 11CT
icon
Related questions
icon
Concept explainers
Question
Use the given data set to complete parts (a) through (c) below. (Use a=0.05.)
10
13
11
14
8.84
12
y
7.45
6.77
12.73
7.11
7.81
6.08
5.39
8.16
6.41
5.72
Click here to view a table of critical values for the correlation coefficient.
* KIR MM IVY E
Using the linear correlation coefficient found in the previous step, determine whether there is sufficient evidence to support the claim of a linear correlation between the two variables. Choose
the correct answer below.
O A. There is sufficient evidence to support the claim of a nonlinear correlation between the two variables.
O B. There is insufficient evidence to support the claim of a nonlinear correlation between the two variables.
O C. There is sufficient evidence to support the claim of a linear correlation between the two variables.
D. There is insufficient evidence to support the claim of a linear correlation between the two variables.
c. Identify the feature of the data that would be missed if part (b) was completed without constructing the scatterplot. Choose the correct answer below.
O A. The scatterplot reveals a perfect straight-line pattern and does not contain any outliers.
B. The scatterplot does not reveal a perfect straight-line pattern, and contains one outlier.
O C. The scatterplot does not reveal a perfect straight-line pattern.
O D. The scatterplot reveals a perfect straight-line pattern, except for the presence of one outlier.
Transcribed Image Text:Use the given data set to complete parts (a) through (c) below. (Use a=0.05.) 10 13 11 14 8.84 12 y 7.45 6.77 12.73 7.11 7.81 6.08 5.39 8.16 6.41 5.72 Click here to view a table of critical values for the correlation coefficient. * KIR MM IVY E Using the linear correlation coefficient found in the previous step, determine whether there is sufficient evidence to support the claim of a linear correlation between the two variables. Choose the correct answer below. O A. There is sufficient evidence to support the claim of a nonlinear correlation between the two variables. O B. There is insufficient evidence to support the claim of a nonlinear correlation between the two variables. O C. There is sufficient evidence to support the claim of a linear correlation between the two variables. D. There is insufficient evidence to support the claim of a linear correlation between the two variables. c. Identify the feature of the data that would be missed if part (b) was completed without constructing the scatterplot. Choose the correct answer below. O A. The scatterplot reveals a perfect straight-line pattern and does not contain any outliers. B. The scatterplot does not reveal a perfect straight-line pattern, and contains one outlier. O C. The scatterplot does not reveal a perfect straight-line pattern. O D. The scatterplot reveals a perfect straight-line pattern, except for the presence of one outlier.
Expert Solution
steps

Step by step

Solved in 2 steps with 4 images

Blurred answer
Knowledge Booster
Correlation, Regression, and Association
Learn more about
Need a deep-dive on the concept behind this application? Look no further. Learn more about this topic, statistics and related others by exploring similar questions and additional content below.
Recommended textbooks for you
Big Ideas Math A Bridge To Success Algebra 1: Stu…
Algebra
ISBN:
9781680331141
Author:
HOUGHTON MIFFLIN HARCOURT
Publisher:
Houghton Mifflin Harcourt
Glencoe Algebra 1, Student Edition, 9780079039897…
Algebra
ISBN:
9780079039897
Author:
Carter
Publisher:
McGraw Hill