Use the given data to find the equation of the regression line. Examine the scatterplot and identify a characteristic of the data that is ignored by the regression line, 10 9 7.44 12.55 13.44 11 D 13 y 11.70 3.21 10.55 13.21 13.46 9.14 13.14 8. 3 7. 12 6 4 5. 5.46 y = +x (Round to two decimal places as needed) Create a scatterplot of the data. Choose the correct graph below. OB. C. OD. OA. AY 25- 20 AY 25 AY 25- AY 25 20 20 20 155 15 15 15 10 10 10 10 0- 05 10 15 20 25 0- 05 10 15 20 25 O5 10 15 20 25 0S 10 15 20 25
Use the given data to find the equation of the regression line. Examine the scatterplot and identify a characteristic of the data that is ignored by the regression line, 10 9 7.44 12.55 13.44 11 D 13 y 11.70 3.21 10.55 13.21 13.46 9.14 13.14 8. 3 7. 12 6 4 5. 5.46 y = +x (Round to two decimal places as needed) Create a scatterplot of the data. Choose the correct graph below. OB. C. OD. OA. AY 25- 20 AY 25 AY 25- AY 25 20 20 20 155 15 15 15 10 10 10 10 0- 05 10 15 20 25 0- 05 10 15 20 25 O5 10 15 20 25 0S 10 15 20 25

Chapter4: Linear Functions
Section: Chapter Questions
Problem 41RE: For the following exercises, consider the data in Table 5, which shows the percent of unemployed in...

Related questions
Question
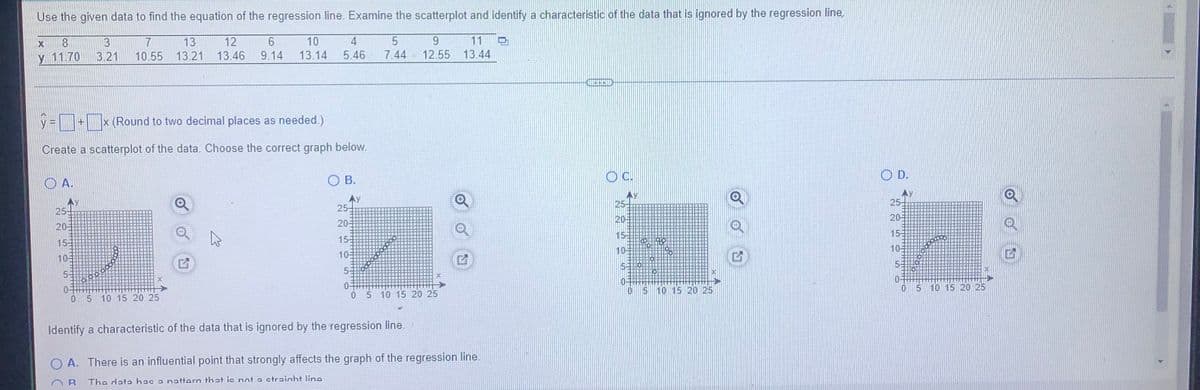
Transcribed Image Text:Use the given data to find the equation of the regression line. Examine the scatterplot and identify a characteristic of the data that is ignored by the regression line,
13
11
3
3.21
12
6
10
4
9.
y 11.70
10.55 13.21
13.46
9.14
13.14
5.46
7.44
12.55 13.44
=D+x (Round to two decimal places as needed.)
Create a scatterplot of the data. Choose the correct graph below.
O A.
O B.
OC.
O D.
AY
25-
25
25-
25
20-
20-
20-
20-
15-
15-
15
155
10
10-
105
105
5-
5-
0 5 10 15 20 25
5 10 15 20 25
05 10 15 20 25
0 5 10 15 20 25
Identify a characteristic of the data that is ignored by the regression line.
O A. There is an influential point that strongly affects the graph of the regression line.
The data hac a nattern that ic not a ctraiaht line
Expert Solution
This question has been solved!
Explore an expertly crafted, step-by-step solution for a thorough understanding of key concepts.

Step by step
Solved in 2 steps with 2 images

Recommended textbooks for you

College Algebra
Algebra
ISBN:
9781305115545
Author:
James Stewart, Lothar Redlin, Saleem Watson
Publisher:
Cengage Learning

Algebra & Trigonometry with Analytic Geometry
Algebra
ISBN:
9781133382119
Author:
Swokowski
Publisher:
Cengage
College Algebra
Algebra
ISBN:
9781305115545
Author:
James Stewart, Lothar Redlin, Saleem Watson
Publisher:
Cengage Learning
Algebra & Trigonometry with Analytic Geometry
Algebra
ISBN:
9781133382119
Author:
Swokowski
Publisher:
Cengage

Functions and Change: A Modeling Approach to Coll…
Algebra
ISBN:
9781337111348
Author:
Bruce Crauder, Benny Evans, Alan Noell
Publisher:
Cengage Learning

Algebra and Trigonometry (MindTap Course List)
Algebra
ISBN:
9781305071742
Author:
James Stewart, Lothar Redlin, Saleem Watson
Publisher:
Cengage Learning