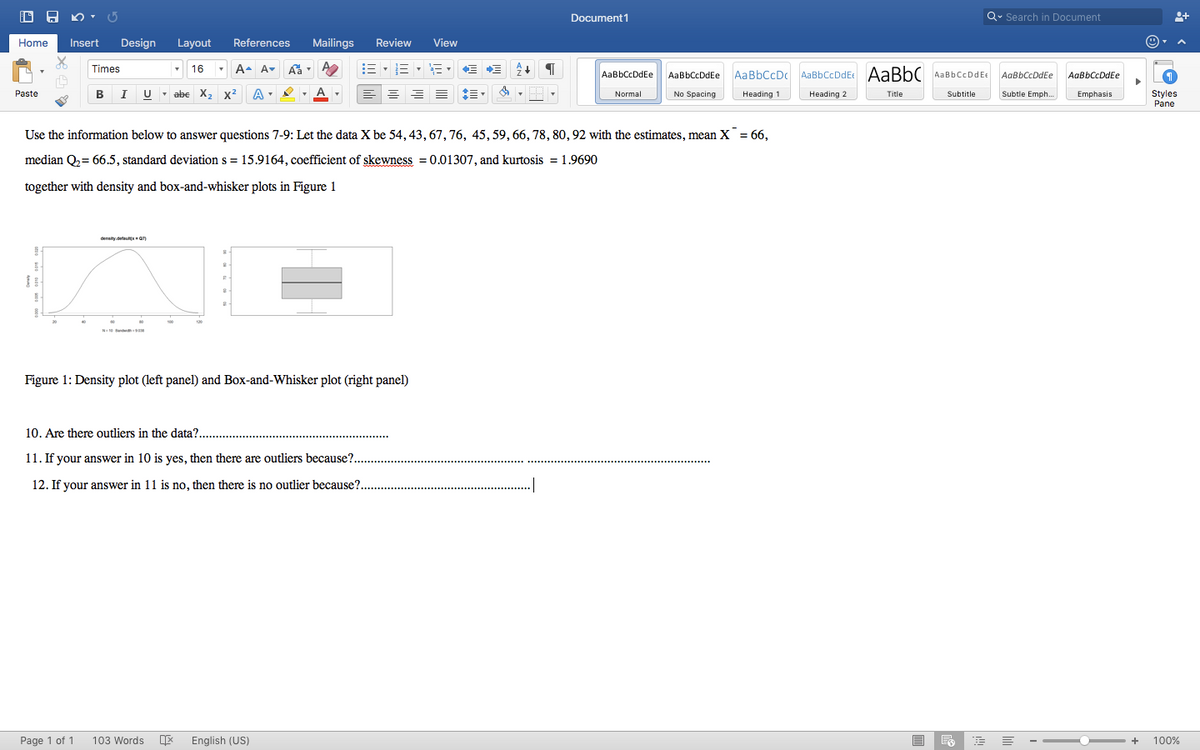
Use the information below to answer questions 7-9: Let the data X be 54, 43, 67, 76, 45, 59, 66, 78, 80, 92 with the estimates, mean x¯= 66, median Q = 66.5, standard deviation s = 15.9164, coefficient of skewness = 0.01307, and kurtosis = 1.9690 together with density and box-and-whisker plots in Figure 1 Figure 1: Density plot (left panel) and Box-and-Whisker plot (right pancl) 10. Are there outliers in the data?.. 11. If your answer in 10 is yes, then there are outliers because?.. 12. If your answer in 11 is no, then there is no outlier because?.


Inverse Normal Distribution
The method used for finding the corresponding z-critical value in a normal distribution using the known probability is said to be an inverse normal distribution. The inverse normal distribution is a continuous probability distribution with a family of two parameters.
Mean, Median, Mode
It is a descriptive summary of a data set. It can be defined by using some of the measures. The central tendencies do not provide information regarding individual data from the dataset. However, they give a summary of the data set. The central tendency or measure of central tendency is a central or typical value for a probability distribution.
Z-Scores
A z-score is a unit of measurement used in statistics to describe the position of a raw score in terms of its distance from the mean, measured with reference to standard deviation from the mean. Z-scores are useful in statistics because they allow comparison between two scores that belong to different normal distributions.

Step by step
Solved in 2 steps with 1 images


