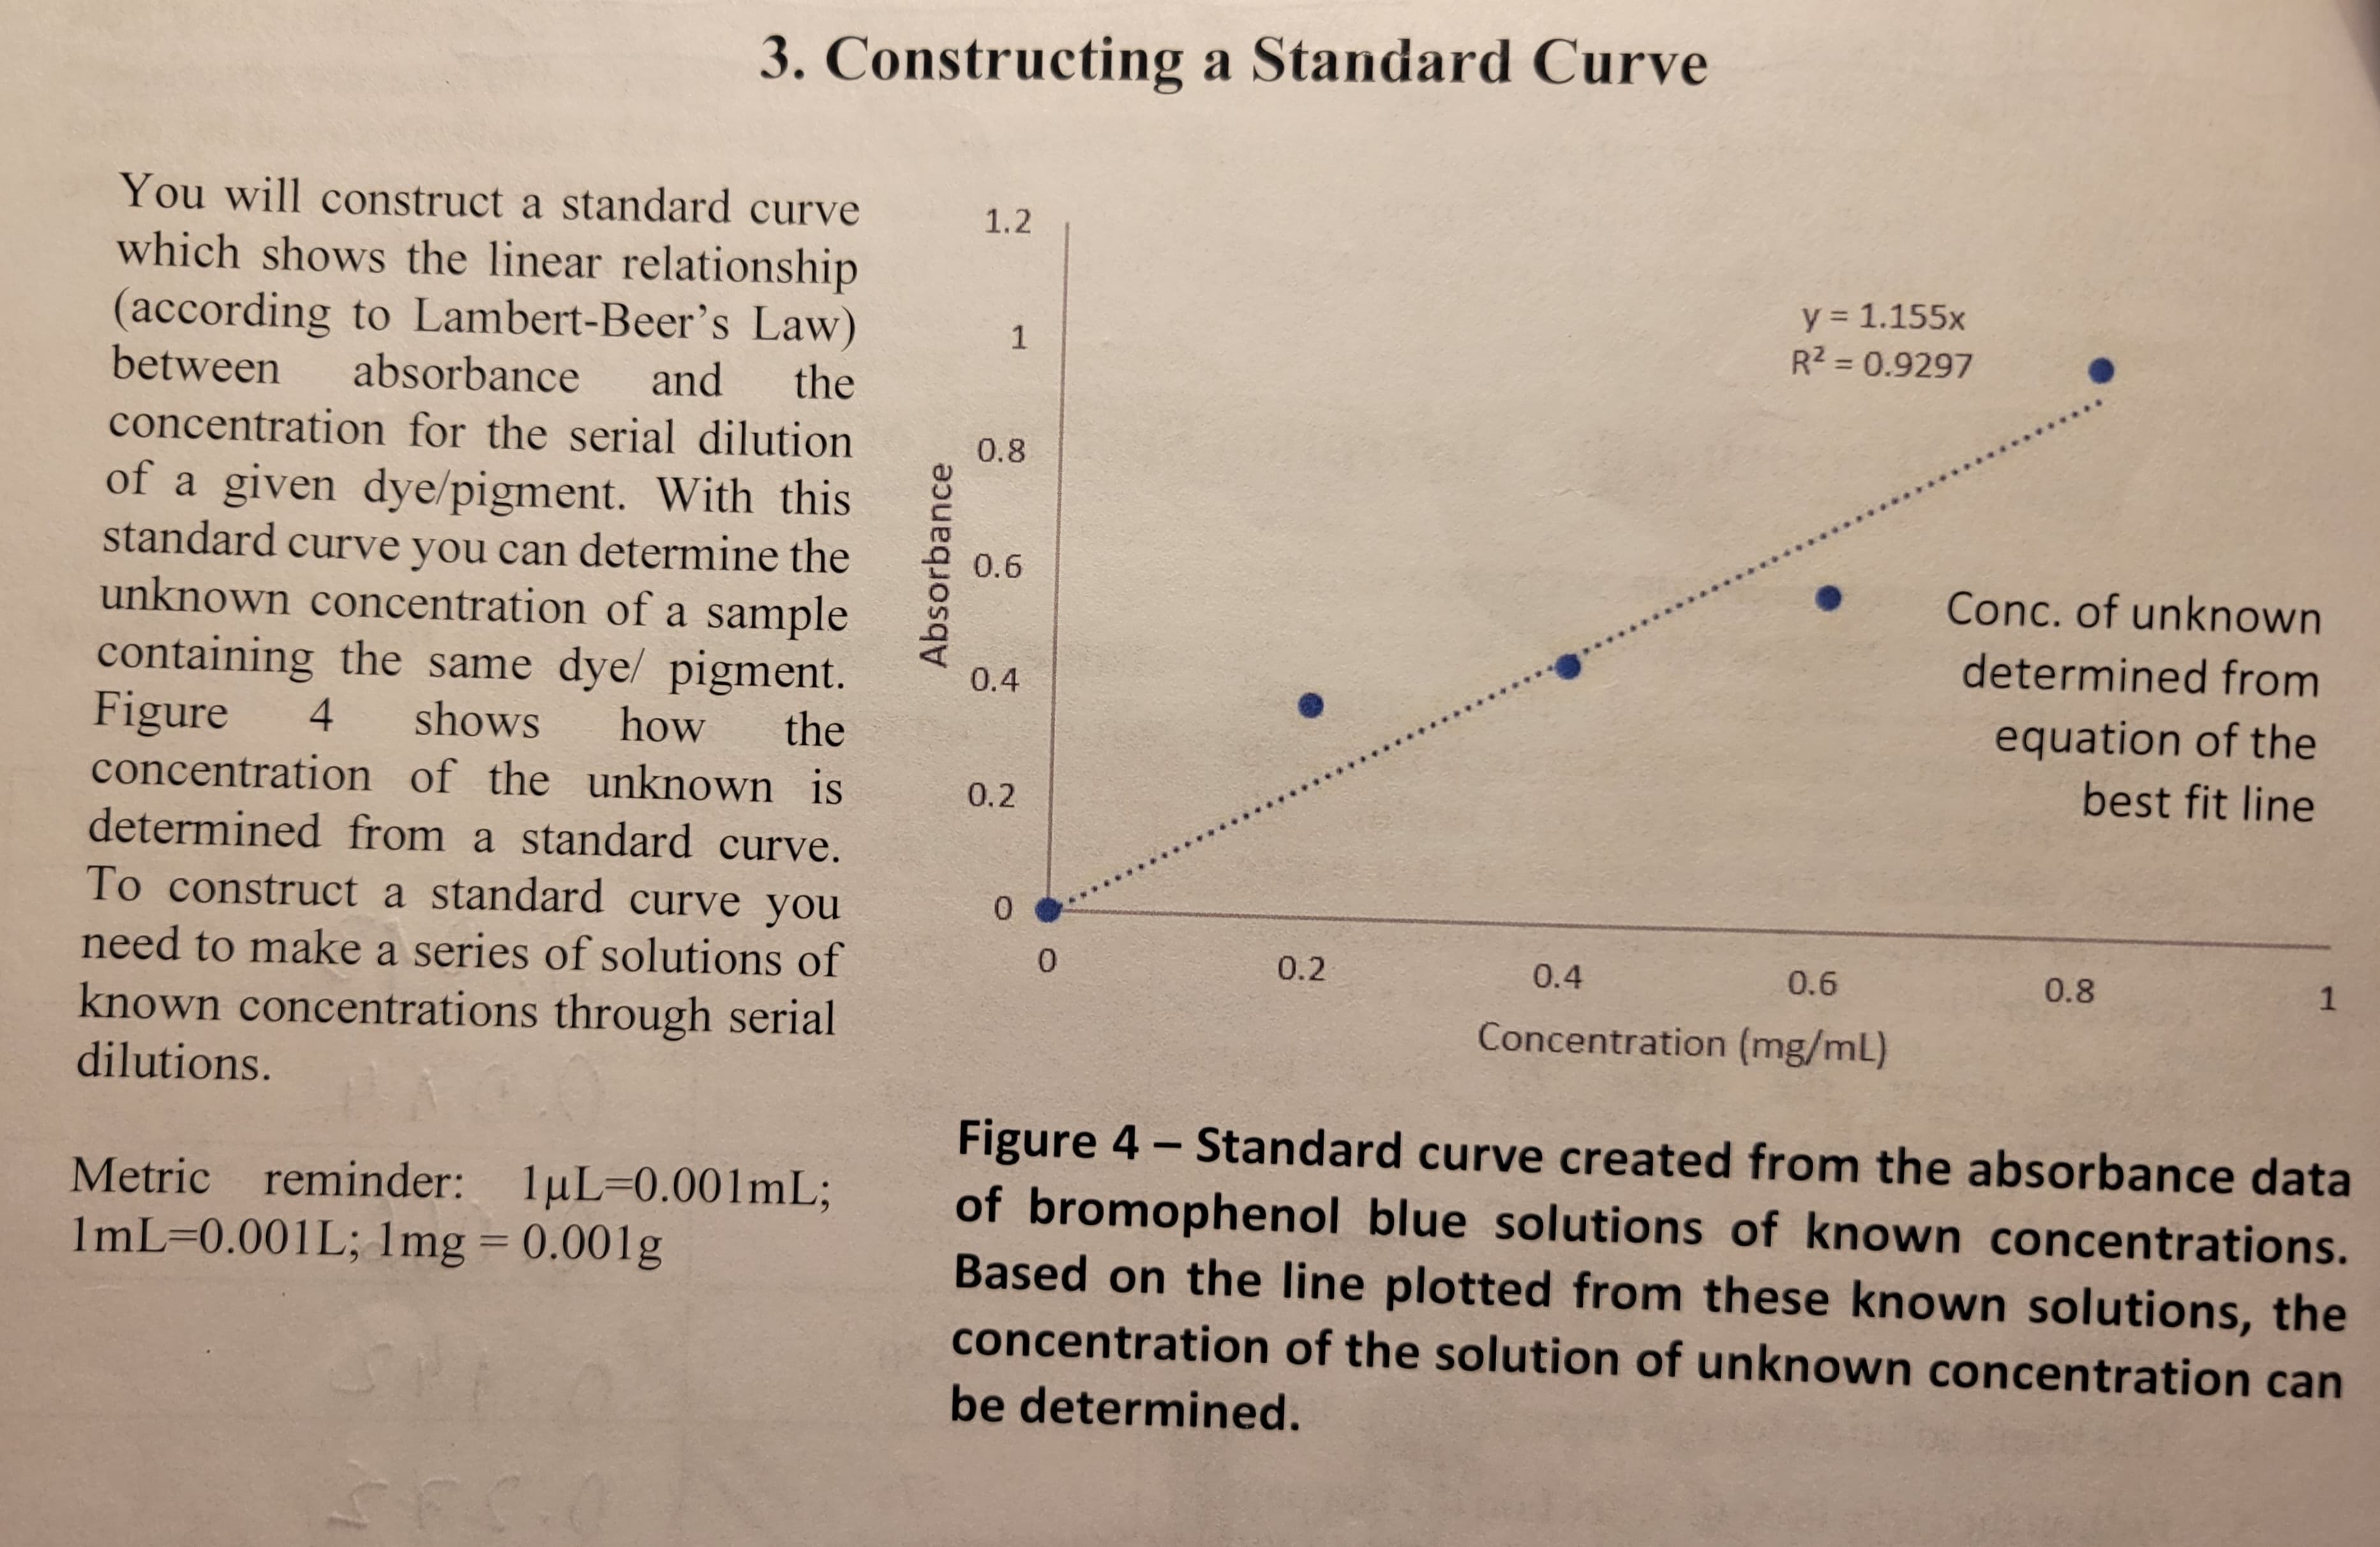
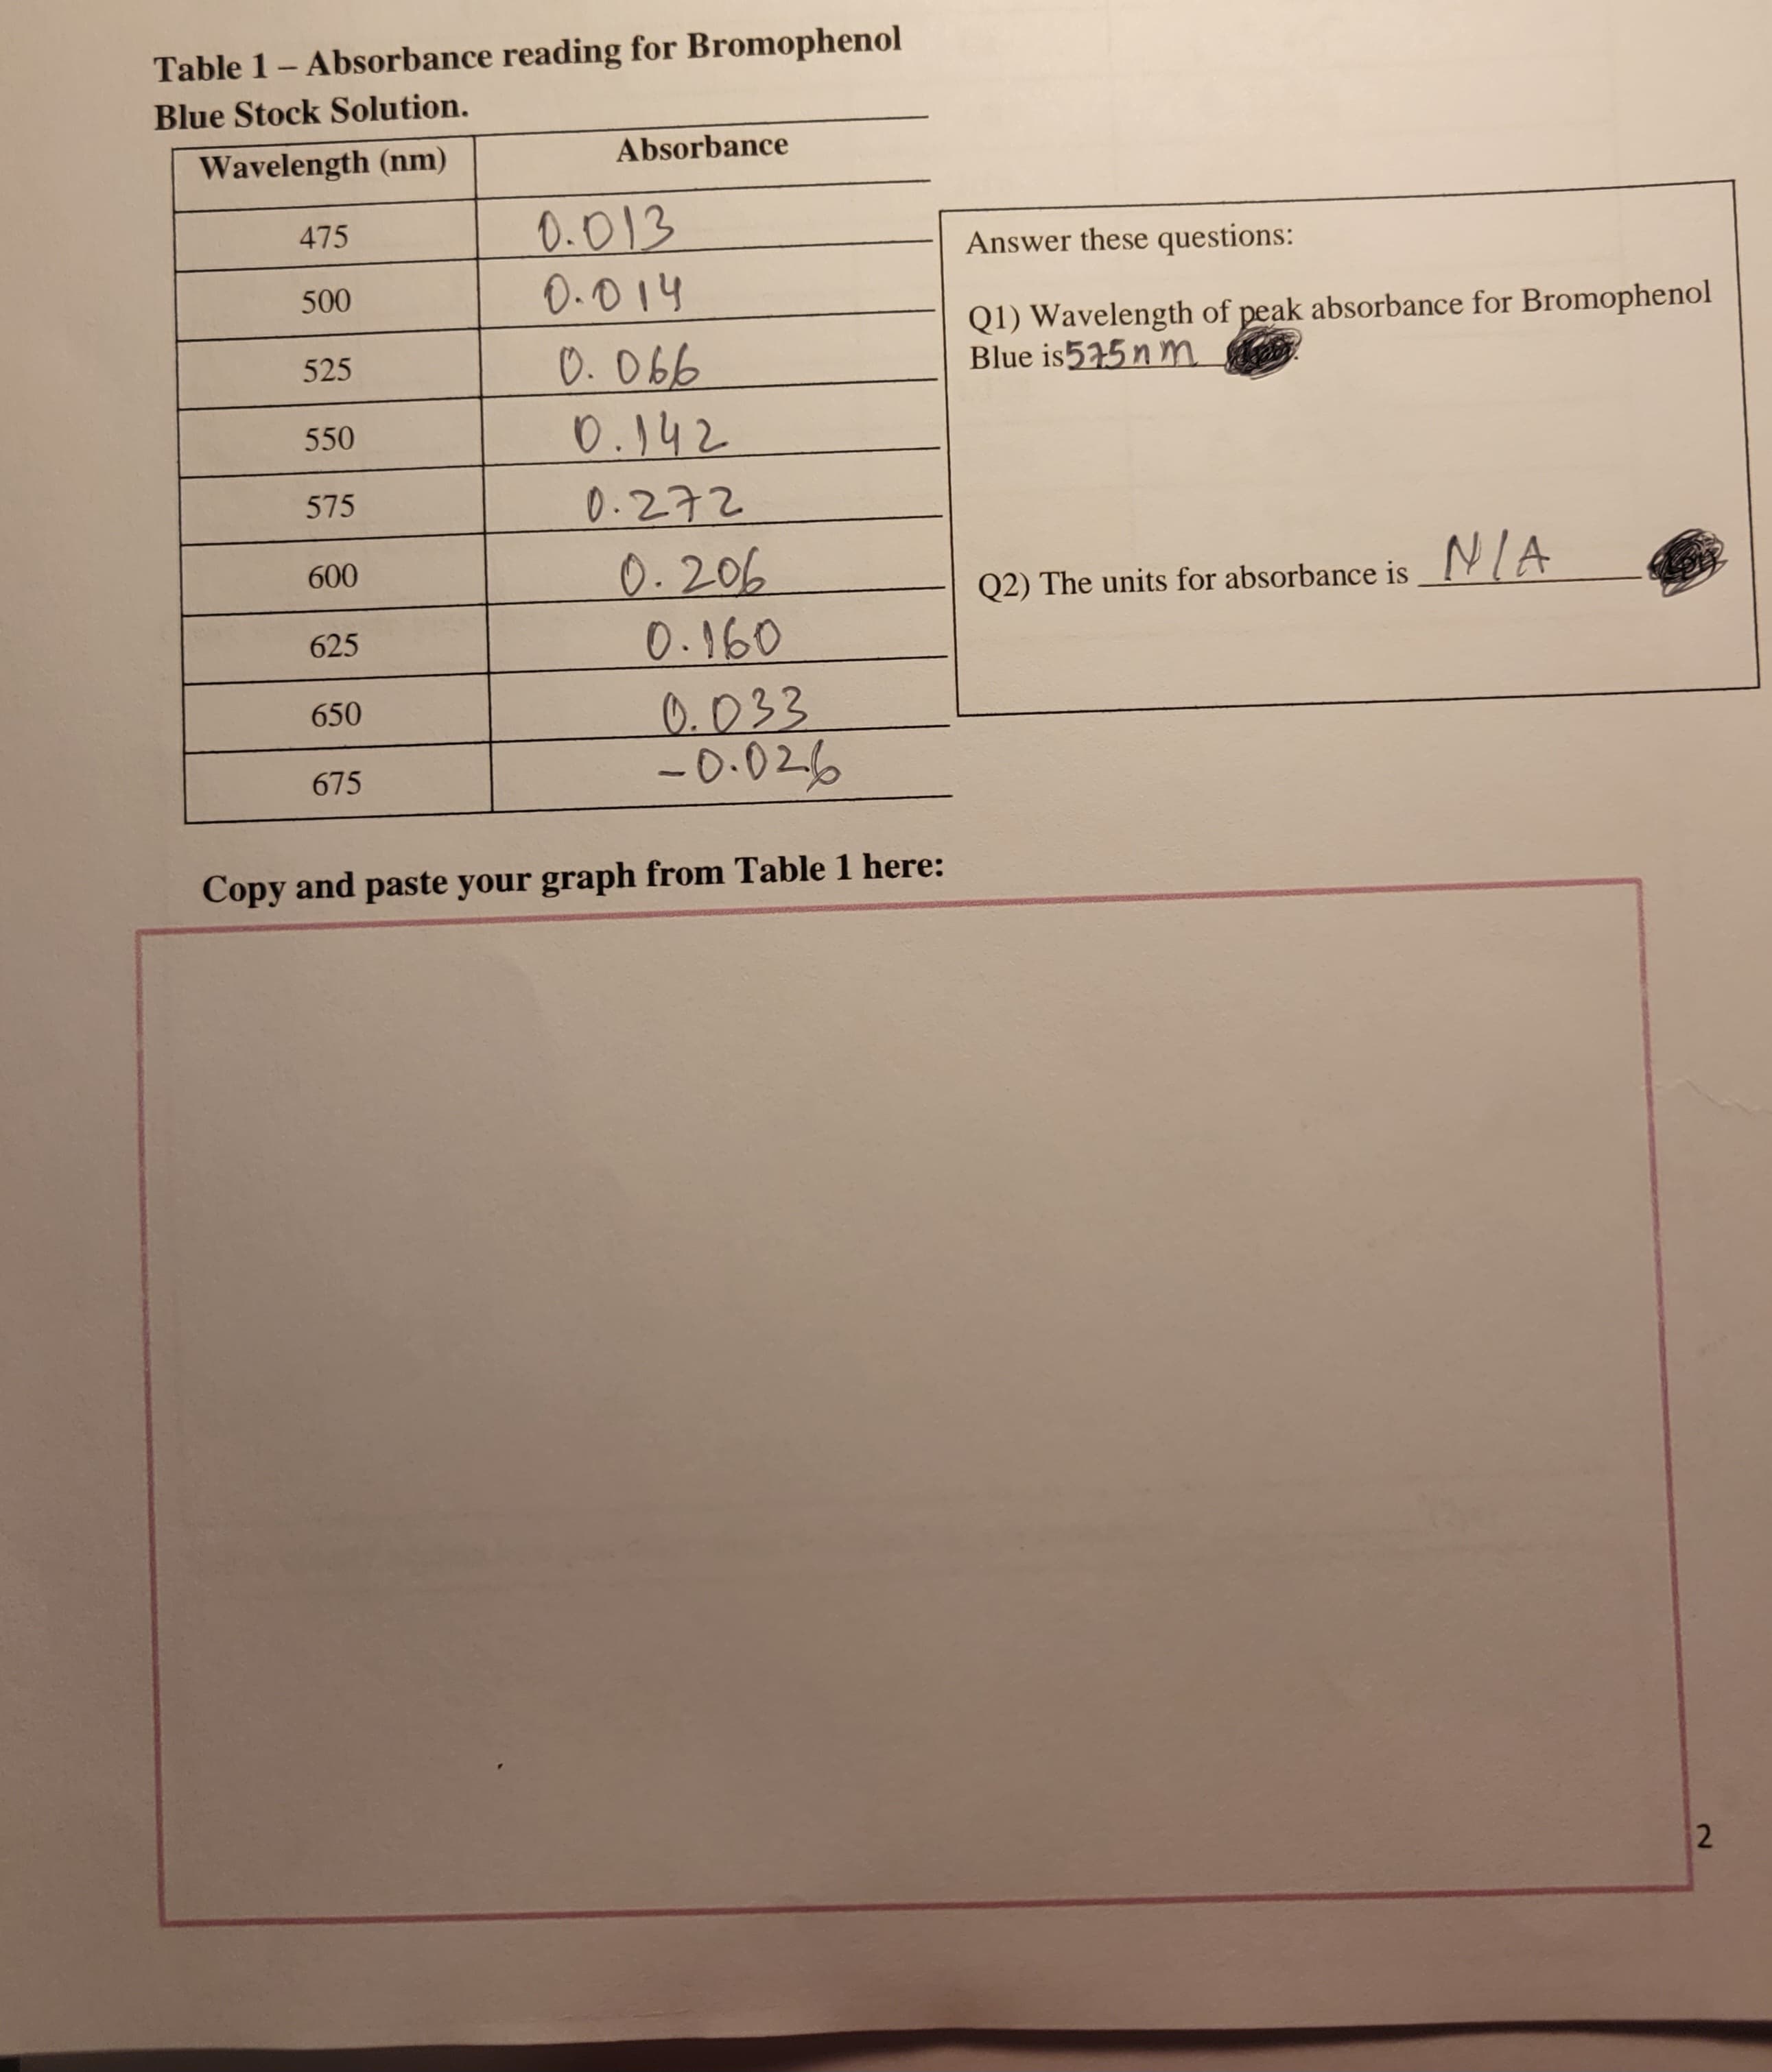
Using data from Table 1 plot a graph similar to Figure 4 in the manual that you will label as “Figure A - Bromophenol Blue Stock Solution Absorbance Spectrum”. Remember all graphs need x-y-axis labels and titles. Plot the graph of order 2 polynomial as the best fit curve. The best-fit curve should show the equation of the line, it does not need to pass through the origin (0,0


Analyzing Infrared Spectra
The electromagnetic radiation or frequency is classified into radio-waves, micro-waves, infrared, visible, ultraviolet, X-rays and gamma rays. The infrared spectra emission refers to the portion between the visible and the microwave areas of electromagnetic spectrum. This spectral area is usually divided into three parts, near infrared (14,290 – 4000 cm-1), mid infrared (4000 – 400 cm-1), and far infrared (700 – 200 cm-1), respectively. The number set is the number of the wave (cm-1).
IR Spectrum Of Cyclohexanone
It is the analysis of the structure of cyclohexaone using IR data interpretation.
IR Spectrum Of Anisole
Interpretation of anisole using IR spectrum obtained from IR analysis.
IR Spectroscopy
Infrared (IR) or vibrational spectroscopy is a method used for analyzing the particle's vibratory transformations. This is one of the very popular spectroscopic approaches employed by inorganic as well as organic laboratories because it is helpful in evaluating and distinguishing the frameworks of the molecules. The infra-red spectroscopy process or procedure is carried out using a tool called an infrared spectrometer to obtain an infrared spectral (or spectrophotometer).
Using data from Table 1 plot a graph similar to Figure 4 in the manual that you will label as “Figure A - Bromophenol Blue Stock Solution Absorbance Spectrum”. Remember all graphs need x-y-axis labels and titles. Plot the graph of order 2 polynomial as the best fit curve. The best-fit curve should show the equation of the line, it does not need to pass through the origin (0,0).


Trending now
This is a popular solution!

Step by step
Solved in 2 steps with 2 images


