Related questions
Question
Use MATLAB to plot the following signal in one figure as shown:
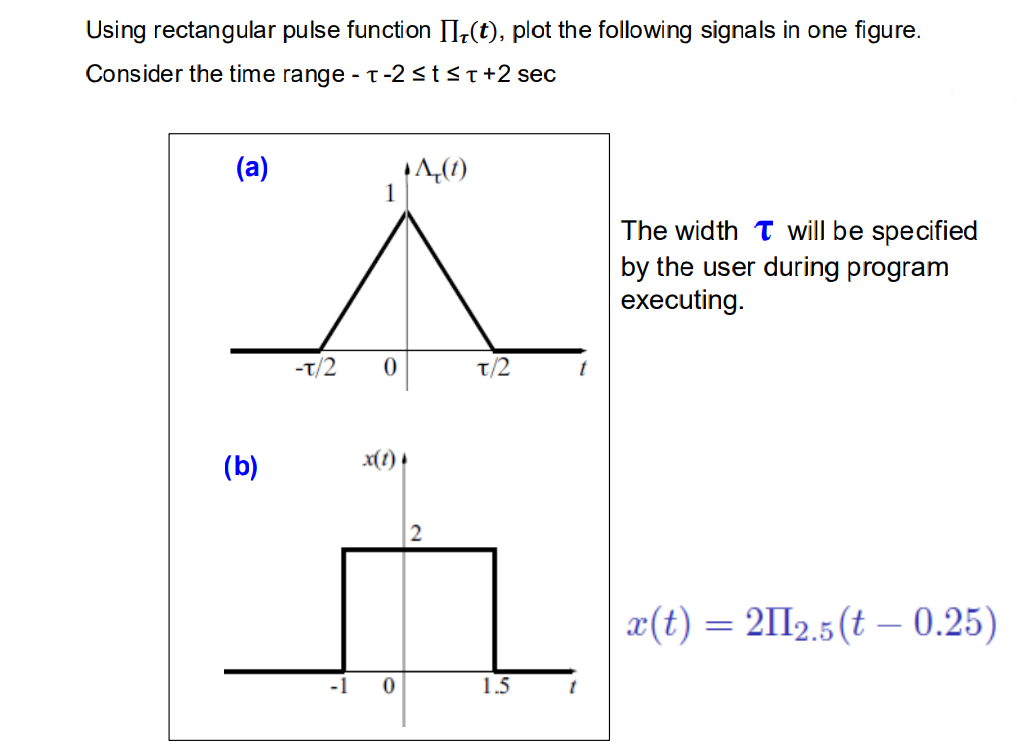

Transcribed Image Text:Using rectangular pulse function II,(t), plot the following signals in one figure.
Consider the time range - T-2 stsT+2 sec
(a)
1
The width T will be specified
by the user during program
executing.
-T/2
t/2
(b)
x(1)
x(t) = 2II2.5(t – 0.25)
1.5
Expert Solution
This question has been solved!
Explore an expertly crafted, step-by-step solution for a thorough understanding of key concepts.

This is a popular solution

Trending nowThis is a popular solution!

Step by stepSolved in 2 steps with 2 images

Knowledge Booster

Similar questions
- Provide the formula and interpretation of the principle of wave particle duality. By name of which scientist is the principle of wave particle duality termed ?arrow_forwardyou recorded a 10 mV finger pulse at a range of 10 V, what would the recording initially look like? Edit View Insert Format Tools Table Paragraph v BIUA e Tv 12pt varrow_forwardDIFFERENTIATING EXPONENTIAL FUNCTIONSarrow_forward
- a) On the graph, draw a curve of best fit that shows the trend in the data points b)Using your curve of best fit, determine the angle of deflection at which the maximumelectron current occurs c) State and explain what can be inferred about electrons from this experimentarrow_forwardCan you explain how to get 7.2 as the answer?arrow_forwardPlease show work for e and f thank you very mucharrow_forward
arrow_back_ios
arrow_forward_ios