Related questions
Question
Using the data below please make two graphs with Excel (or a similar program).
1. Absorbance (v-axis) vs. A (x-axis) for the absorbance curve of the dye solution. Connect the points with a smooth curve.
2. Absorbance (y-axis) vs. concentration (x-axis) for the Beer's Law data. Draw a best-fit line or use a program such as Excel and do a least-squares fit to determine the best-fit line through the points.
please answer super super fast please please need it now its urgent just creat the graphs

Transcribed Image Text:**Educational Website Transcription**
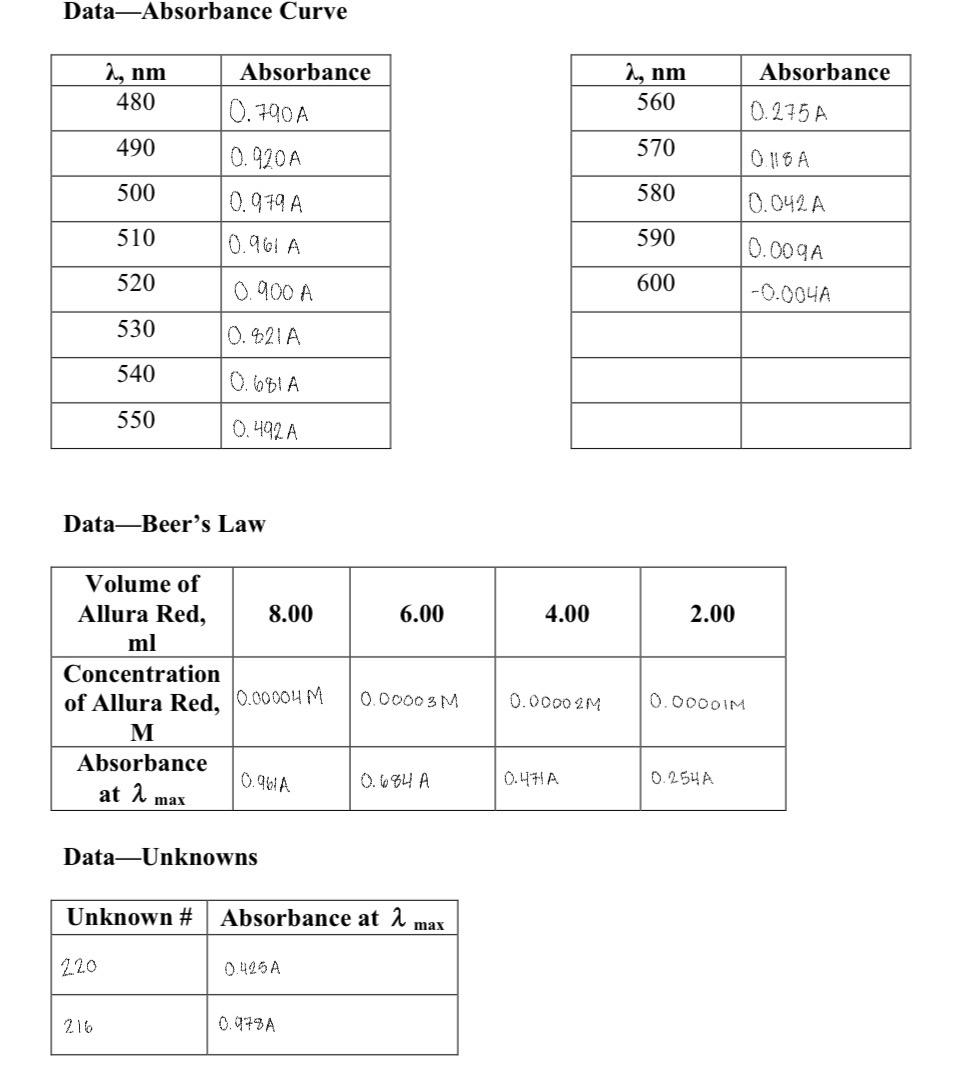
### Data — Absorbance Curve
#### Table 1: Absorbance Measurements
| λ (nm) | Absorbance |
|--------|------------|
| 480 | 0.790 A |
| 490 | 0.920 A |
| 500 | 0.979 A |
| 510 | 0.961 A |
| 520 | 0.900 A |
| 530 | 0.621 A |
| 540 | 0.604 A |
| 550 | 0.492 A |
| λ (nm) | Absorbance |
|--------|------------|
| 560 | 0.275 A |
| 570 | 0.118 A |
| 580 | 0.042 A |
| 590 | 0.009 A |
| 600 | -0.004 A |
### Data — Beer’s Law
#### Table 2: Beer’s Law Data
| Volume of Allura Red (ml) | Concentration of Allura Red (M) | Absorbance at λₘₐₓ |
|---------------------------|---------------------------------|--------------------|
| 8.00 | 0.00004 M | 0.981 A |
| 6.00 | 0.00003 M | 0.684 A |
| 4.00 | 0.00002 M | 0.474 A |
| 2.00 | 0.00001 M | 0.254 A |
### Data — Unknowns
#### Table 3: Unknown Samples
| Unknown # | Absorbance at λₘₐₓ |
|-----------|---------------------|
| 220 | 0.426 A |
| 216 | 0.973 A |
Expert Solution
This question has been solved!
Explore an expertly crafted, step-by-step solution for a thorough understanding of key concepts.

Step by stepSolved in 3 steps with 5 images

Knowledge Booster

Similar questions
- The following describes similarities between true solutions and colloidal dispersions 1. Filtering is not an effective method of particle separation/isolation 2. Particles deflect light 3. Particles cannot be observed without magnification. arrow_forwardTASK 1: DISCUSSION 1 Discuss diffusion mechanism below. Explain in terms of mechanism process and how it is important in material industries. Explain in Two (2) pages with at least 10 journal references. Figure 1: Vacancy diffusion shows motion of the host atom to vacant space End of documentarrow_forwardPlease show each and every work. Don't use chatgpt, only Handwritten.arrow_forward
- Draw the influence line For the reaction at A then C then at point D for the figure below.arrow_forwardWith the data shown below, please answer the following: A. Which of the two inhibitors is more efficient at high substrate concentrations? At low substrate concentrations? Explain your reasoning. Determine the binding constant (KI) for inhibitors A and B. Show the calculations.arrow_forward
arrow_back_ios
arrow_forward_ios