Using the data shown in the accompanying contingency table, test whether the population proportions differ at the = 0.05 level of significance by determining (a) the null and alternative hypotheses, (b) the test statistic, and (c) the P-value. Assume that the samples are dependent and were obtained randomly. Click the icon to view the contingency table. (a) Let p, represent the proportion of success for treatment A and p, represent the proportion of success for treatment B. What are the null and alternative hypotheses? OA. Ho: P1 = P2 H1: P1 #P2 O B. Ho: P1 =P2 H1: P1 > P2 O C. Ho: P1 =P2 H1: P1
Using the data shown in the accompanying contingency table, test whether the population proportions differ at the = 0.05 level of significance by determining (a) the null and alternative hypotheses, (b) the test statistic, and (c) the P-value. Assume that the samples are dependent and were obtained randomly. Click the icon to view the contingency table. (a) Let p, represent the proportion of success for treatment A and p, represent the proportion of success for treatment B. What are the null and alternative hypotheses? OA. Ho: P1 = P2 H1: P1 #P2 O B. Ho: P1 =P2 H1: P1 > P2 O C. Ho: P1 =P2 H1: P1

College Algebra (MindTap Course List)
12th Edition
ISBN:9781305652231
Author:R. David Gustafson, Jeff Hughes
Publisher:R. David Gustafson, Jeff Hughes
Chapter8: Sequences, Series, And Probability
Section8.7: Probability
Problem 58E: What is meant by the sample space of an experiment?

Related questions
Topic Video
Question
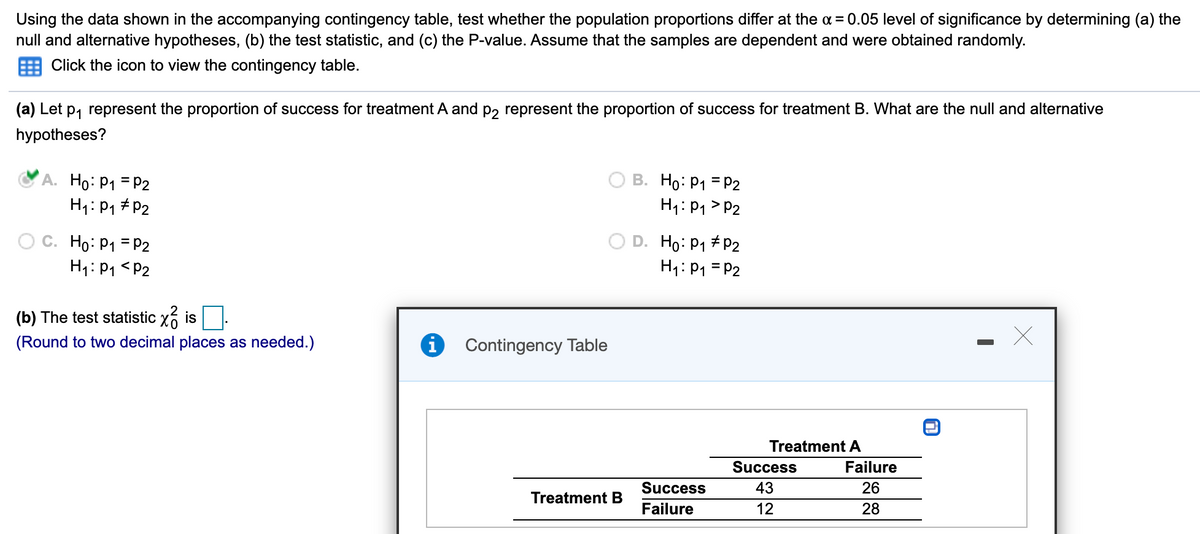
Transcribed Image Text:Using the data shown in the accompanying contingency table, test whether the population proportions differ at the a = 0.05 level of significance by determining (a) the
null and alternative hypotheses, (b) the test statistic, and (c) the P-value. Assume that the samples are dependent and were obtained randomly.
Click the icon to view the contingency table.
(a) Let p, represent the proportion of success for treatment A and p, represent the proportion of success for treatment B. What are the null and alternative
hypotheses?
A. Ho: P1 = P2
H1: P1 # P2
B. Ho: P1 = P2
H1: P1 > P2
Ho: P1 = P2
H1: P1 <P2
D. Ho: P1 # P2
H1: P1 = P2
(b) The test statistic x6 is
(Round to two decimal places as needed.)
Contingency Table
Treatment A
Success
Failure
Success
43
26
Treatment B
Failure
28
Expert Solution
This question has been solved!
Explore an expertly crafted, step-by-step solution for a thorough understanding of key concepts.

This is a popular solution!

Trending now
This is a popular solution!

Step by step
Solved in 2 steps with 6 images

Knowledge Booster


Learn more about
Need a deep-dive on the concept behind this application? Look no further. Learn more about this topic, statistics and related others by exploring similar questions and additional content below.Recommended textbooks for you
College Algebra (MindTap Course List)
Algebra
ISBN:
9781305652231
Author:
R. David Gustafson, Jeff Hughes
Publisher:
Cengage Learning
College Algebra (MindTap Course List)
Algebra
ISBN:
9781305652231
Author:
R. David Gustafson, Jeff Hughes
Publisher:
Cengage Learning