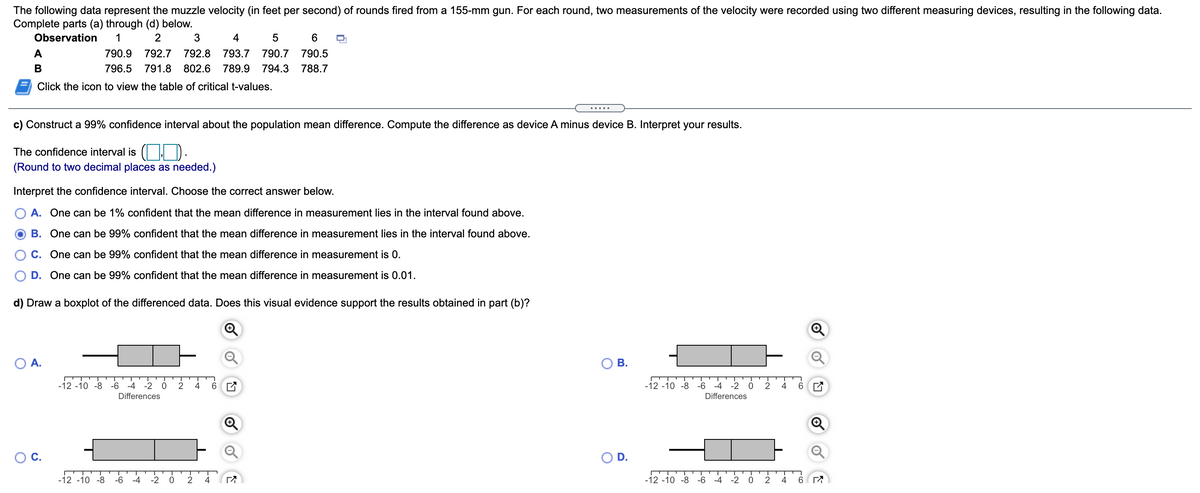
The following data represent the muzzle velocity (in feet per second) of rounds fired from a 155-mm gun. For each round, two measurements of the velocity were recorded using two different measuring devices, resulting in the following data. Complete parts (a) through (d) below. Observation 1 2 3 4 6 790.9 792.7 792.8 793.7 790.7 790.5 B 796.5 791.8 802.6 789.9 794.3 788.7 E Click the icon to view the table of critical t-values. c) Construct a 99% confidence interval about the population mean difference. Compute the difference as device A minus device B. Interpret your results. The confidence interval is (OD. (Round to two decimal places as needed.) Interpret the confidence interval. Choose the correct answer below. O A. One can be 1% confident that the mean difference in measurement lies in the interval found above. O B. One can be 99% confident that the mean difference in measurement lies in the interval found above. O C. One can be 99% confident that the mean difference in measurement is 0. O D. One can be 99% confident that the mean difference in measurement is 0.01. d) Draw a boxplot of the differenced data. Does this visual evidence support the results obtained in part (b)? OA. OB. Differences Differences OC. OD.


Minimization
In mathematics, traditional optimization problems are typically expressed in terms of minimization. When we talk about minimizing or maximizing a function, we refer to the maximum and minimum possible values of that function. This can be expressed in terms of global or local range. The definition of minimization in the thesaurus is the process of reducing something to a small amount, value, or position. Minimization (noun) is an instance of belittling or disparagement.
Maxima and Minima
The extreme points of a function are the maximum and the minimum points of the function. A maximum is attained when the function takes the maximum value and a minimum is attained when the function takes the minimum value.
Derivatives
A derivative means a change. Geometrically it can be represented as a line with some steepness. Imagine climbing a mountain which is very steep and 500 meters high. Is it easier to climb? Definitely not! Suppose walking on the road for 500 meters. Which one would be easier? Walking on the road would be much easier than climbing a mountain.
Concavity
In calculus, concavity is a descriptor of mathematics that tells about the shape of the graph. It is the parameter that helps to estimate the maximum and minimum value of any of the functions and the concave nature using the graphical method. We use the first derivative test and second derivative test to understand the concave behavior of the function.
The following data represent the muzzle velocity (in feet per second) of rounds fired from a 155-mm gun. For each round, two measurements of the velocity were recorded using two different measuring devices, resulting in the following data. Complete parts (c) through (d) below.


Trending now
This is a popular solution!

Step by step
Solved in 2 steps with 1 images


