What forecasting method would you use for this data based on the MAPE? Please find my calculations after this question Cumulative Mean Moving averages with N=3 O Naive
What forecasting method would you use for this data based on the MAPE? Please find my calculations after this question Cumulative Mean Moving averages with N=3 O Naive

Glencoe Algebra 1, Student Edition, 9780079039897, 0079039898, 2018
18th Edition
ISBN:9780079039897
Author:Carter
Publisher:Carter
Chapter10: Statistics
Section10.5: Comparing Sets Of Data
Problem 13PPS

Related questions
Question
Help me
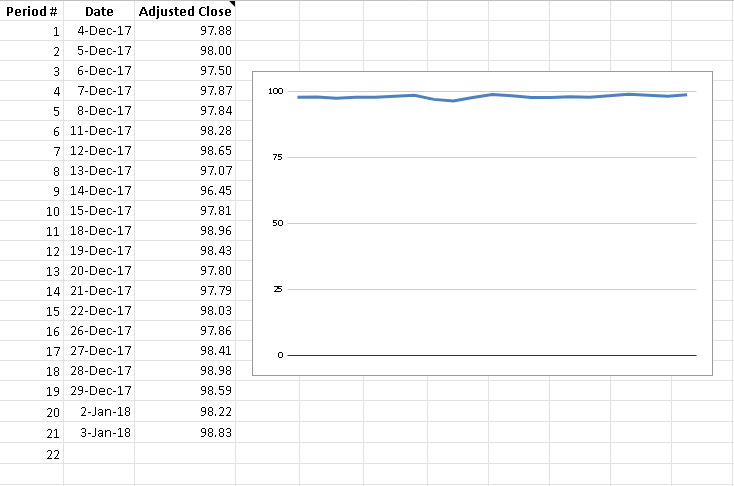
Transcribed Image Text:Period #
Adjusted Close
Date
1.
4-Dec-17
97.88
2
5-Dec-17
98.00
6-Dec-17
97.50
7-Dec-17
97.87
100
5
8-Dec-17
97.84
6 11-Dec-17
98.28
7 12-Dec-17
98.65
75
8 13-Dec-17
97.07
9 14-Dec-17
96.45
10 15-Dec-17
97.81
50
11 18-Dec-17
98.96
12 19-Dec-17
98.43
13 20-Dec-17
97.80
14 21-Dec-17
97.79
25
15 22-Dec-17
98.03
16 26-Dec-17
97.86
17 27-Dec-17
98,41
18 28-Dec-17
98.98
19 29-Dec-17
98.59
20
2-Jan-18
98.22
21
3-Jan-18
98.83
22
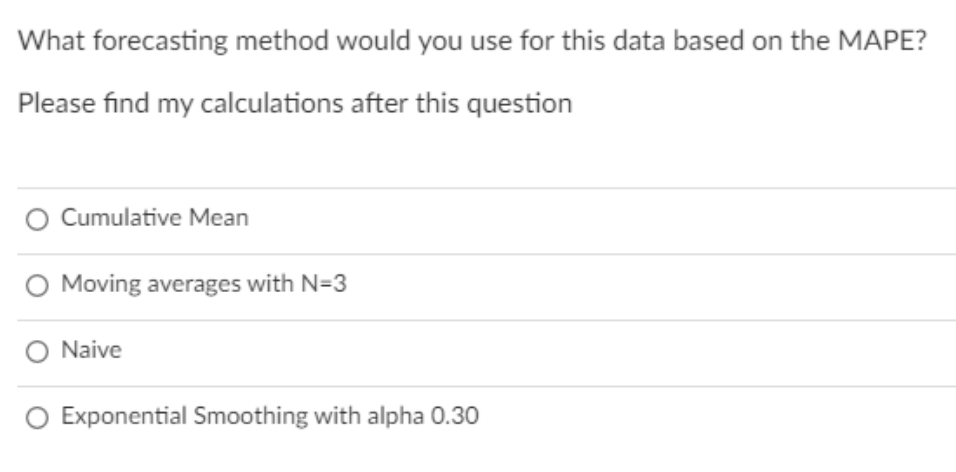
Transcribed Image Text:What forecasting method would you use for this data based on the MAPE?
Please find my calculations after this question
O Cumulative Mean
O Moving averages with N=3
O Naive
O Exponential Smoothing with alpha 0.30
Expert Solution
This question has been solved!
Explore an expertly crafted, step-by-step solution for a thorough understanding of key concepts.

This is a popular solution!

Trending now
This is a popular solution!

Step by step
Solved in 2 steps with 1 images

Recommended textbooks for you
Glencoe Algebra 1, Student Edition, 9780079039897…
Algebra
ISBN:
9780079039897
Author:
Carter
Publisher:
McGraw Hill
Glencoe Algebra 1, Student Edition, 9780079039897…
Algebra
ISBN:
9780079039897
Author:
Carter
Publisher:
McGraw Hill