UV-vis analysis; spectra taken in methanol a. Below is the UV-vis spectrum of acetophenone. Label the Amax peak that corresponds to the n n* electronic transition 1.4 1.2 1.0 0.8 0.6 0.4 0.2N 250 300 350 400 242 279 A 1.486 0.294
UV-vis analysis; spectra taken in methanol a. Below is the UV-vis spectrum of acetophenone. Label the Amax peak that corresponds to the n n* electronic transition 1.4 1.2 1.0 0.8 0.6 0.4 0.2N 250 300 350 400 242 279 A 1.486 0.294

Chapter12: Structure Determination: Mass Spectrometry And Infrared Spectroscopy
Section12.SE: Something Extra
Problem 48AP: The infrared spectrum of the compound with the mass spectrum shown below lacks any significant...

Related questions
Question
Problem attached
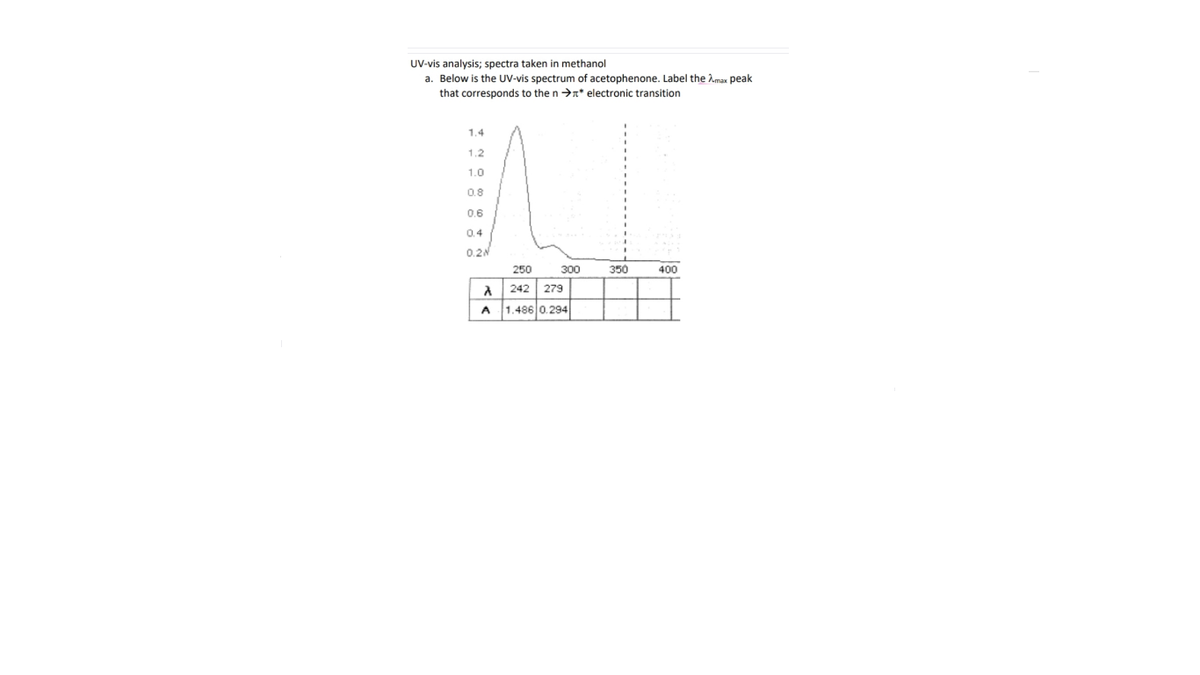
Transcribed Image Text:UV-vis analysis; spectra taken in methanol
a. Below is the UV-vis spectrum of acetophenone. Label the Amax peak
that corresponds to the n n* electronic transition
1.4
1.2
1.0
0.8
0.6
0.4
0.2N
250
300
350
400
242 279
A
1.486 0.294
Expert Solution
This question has been solved!
Explore an expertly crafted, step-by-step solution for a thorough understanding of key concepts.

This is a popular solution!

Trending now
This is a popular solution!

Step by step
Solved in 3 steps with 1 images

Knowledge Booster


Learn more about
Need a deep-dive on the concept behind this application? Look no further. Learn more about this topic, chemistry and related others by exploring similar questions and additional content below.Recommended textbooks for you

Macroscale and Microscale Organic Experiments
Chemistry
ISBN:
9781305577190
Author:
Kenneth L. Williamson, Katherine M. Masters
Publisher:
Brooks Cole

Organic Chemistry: A Guided Inquiry
Chemistry
ISBN:
9780618974122
Author:
Andrei Straumanis
Publisher:
Cengage Learning
Macroscale and Microscale Organic Experiments
Chemistry
ISBN:
9781305577190
Author:
Kenneth L. Williamson, Katherine M. Masters
Publisher:
Brooks Cole
Organic Chemistry: A Guided Inquiry
Chemistry
ISBN:
9780618974122
Author:
Andrei Straumanis
Publisher:
Cengage Learning