What is the Beta that shows the strongest controlled association?

MATLAB: An Introduction with Applications
6th Edition
ISBN:9781119256830
Author:Amos Gilat
Publisher:Amos Gilat
Chapter1: Starting With Matlab
Section: Chapter Questions
Problem 1P

Related questions
Question
What is the Beta that shows the strongest controlled association?
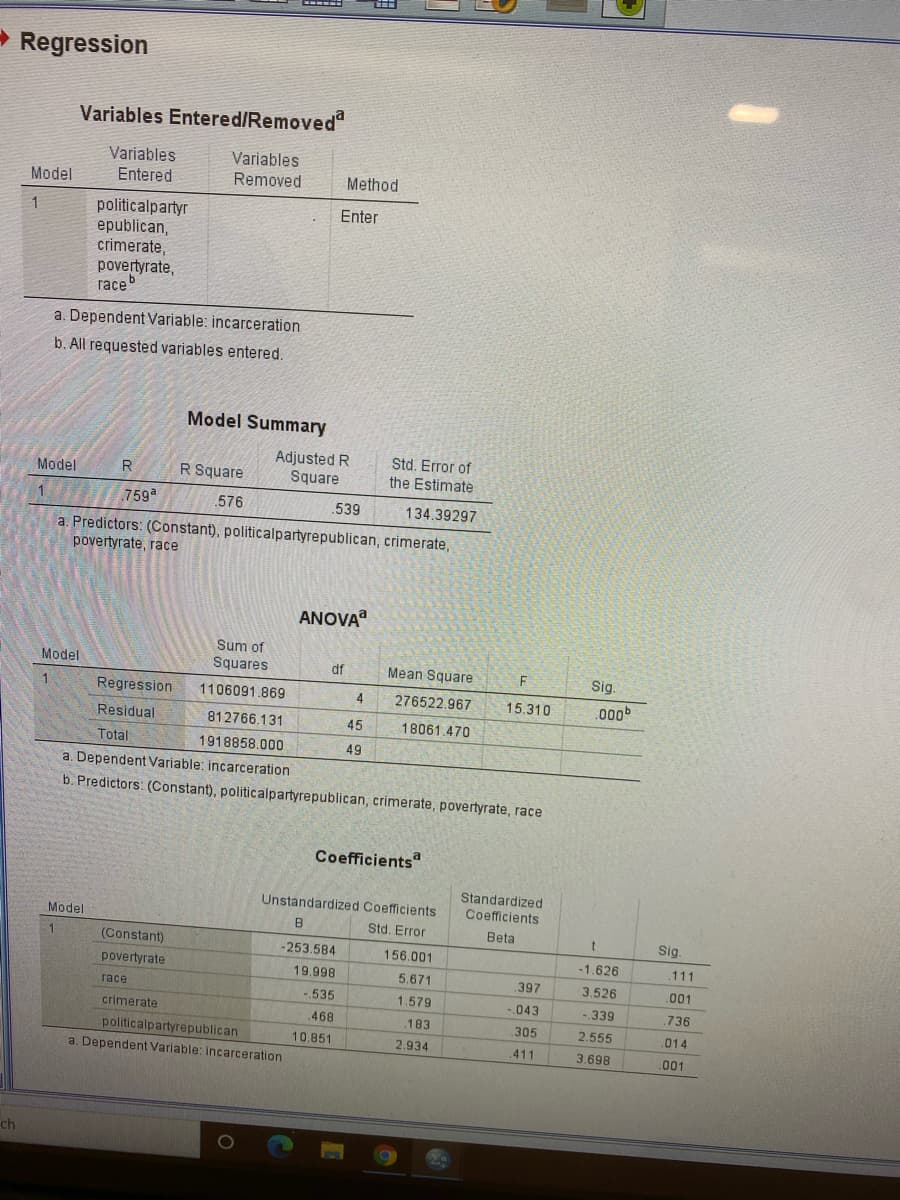
Transcribed Image Text:- Regression
Variables Entered/Removed
Variables
Variables
Entered
Model
Removed
Method
politicalpartyr
epublican,
crimerate,
povertyrate,
raceb
1
Enter
a. Dependent Variable: incarceration
b. All requested variables entered.
Model Summary
Adjusted R
Square
Std. Error of
the Estimate
Model
R Square
759
576
539
134.39297
a. Predictors: (Constant), politicalpartyrepublican, crimerate,
povertyrate, race
ANOVA
Sum of
Squares
Model
df
Mean Square
F
Sig.
Regression
1106091.869
4
276522.967
15.310
000b
Residual
812766.131
45
18061.470
Total
1918858.000
49
a. Dependent Variable: incarceration
b. Predictors: (Constant), politicalpartyrepublican, crimerate, povertyrate, race
Coefficients
Standardized
Unstandardized Coefficients
Coefficients
Model
Std. Error
Beta
Sig.
(Constant)
-253.584
156.001
-1.626
.111
povertyrate
19.998
5.671
397
3.526
.001
race
-.535
1.579
.043
339
736
crimerate
.468
.183
305
2.555
.014
politicalpartyrepublican
10.851
2,934
411
3.698
01
a. Dependent Variable: incarceration
ch
![/VARIABLES=incarceration povertyrate race politicalpartyrepublican crimerat
/ PRINT=TWOTAIL NOSIG
/MISSING=PAIRWISE.
Correlations
[DataSet0]
Correlations
politicalpartyr
epublican
incarceration
povertyrate
race
crimerate
incarceration
Pearson Corelation
603"
1.
-152
440
490
Sig. (2-tailed)
.000
290
001
000
N
50
50
50
50
50
povertyrate
Pearson Correlation
.603"
- 311"
1
139
444
Sig. (2-tailed)
.000
.028
337
.001
50
50
50
50
50
race
Pearson Correlation
-152
-311
1
394*
- 486*
Sig. (2-tailed)
290
028
.005
.000
N
50
50
50
politicalpartyrepublican
Pearson Correlation
50
50
440
139
394"
-030
Sig. (2-tailed)
001
337
05
836
50
50
50
crimerate
50
50
Pearson Correlation
490
444"
486
- 030
Sig. (2-tailed)
000
001
00
836
50
50
50
** Correlation is significant at the 0.01 level (2-tailed).
50
50
*. Correlation is significant at the 0.05 level (2-tailed).
REGRESSION
/MISSING LISTWISE
/STATISTICS COEFF OUTS R ANOVA
/CRITERIA=PIN (.05) POUT (. 10)
/NOORIGIN
/DEPENDENT incarceration
/METHOD=ENTER povertyrate race crimerate politicalpartyrepublican.
- Regression
Variables Entered/Removed"
ch
27](/v2/_next/image?url=https%3A%2F%2Fcontent.bartleby.com%2Fqna-images%2Fquestion%2F985faa7b-eb2f-4c1e-b4cd-00f056084517%2F6ca925d6-8cb9-4870-b026-2e407f1453d0%2Fpq6cwvl_processed.jpeg&w=3840&q=75)
Transcribed Image Text:/VARIABLES=incarceration povertyrate race politicalpartyrepublican crimerat
/ PRINT=TWOTAIL NOSIG
/MISSING=PAIRWISE.
Correlations
[DataSet0]
Correlations
politicalpartyr
epublican
incarceration
povertyrate
race
crimerate
incarceration
Pearson Corelation
603"
1.
-152
440
490
Sig. (2-tailed)
.000
290
001
000
N
50
50
50
50
50
povertyrate
Pearson Correlation
.603"
- 311"
1
139
444
Sig. (2-tailed)
.000
.028
337
.001
50
50
50
50
50
race
Pearson Correlation
-152
-311
1
394*
- 486*
Sig. (2-tailed)
290
028
.005
.000
N
50
50
50
politicalpartyrepublican
Pearson Correlation
50
50
440
139
394"
-030
Sig. (2-tailed)
001
337
05
836
50
50
50
crimerate
50
50
Pearson Correlation
490
444"
486
- 030
Sig. (2-tailed)
000
001
00
836
50
50
50
** Correlation is significant at the 0.01 level (2-tailed).
50
50
*. Correlation is significant at the 0.05 level (2-tailed).
REGRESSION
/MISSING LISTWISE
/STATISTICS COEFF OUTS R ANOVA
/CRITERIA=PIN (.05) POUT (. 10)
/NOORIGIN
/DEPENDENT incarceration
/METHOD=ENTER povertyrate race crimerate politicalpartyrepublican.
- Regression
Variables Entered/Removed"
ch
27
Expert Solution
This question has been solved!
Explore an expertly crafted, step-by-step solution for a thorough understanding of key concepts.

Step by step
Solved in 2 steps

Recommended textbooks for you
MATLAB: An Introduction with Applications
Statistics
ISBN:
9781119256830
Author:
Amos Gilat
Publisher:
John Wiley & Sons Inc

Probability and Statistics for Engineering and th…
Statistics
ISBN:
9781305251809
Author:
Jay L. Devore
Publisher:
Cengage Learning

Statistics for The Behavioral Sciences (MindTap C…
Statistics
ISBN:
9781305504912
Author:
Frederick J Gravetter, Larry B. Wallnau
Publisher:
Cengage Learning
MATLAB: An Introduction with Applications
Statistics
ISBN:
9781119256830
Author:
Amos Gilat
Publisher:
John Wiley & Sons Inc
Probability and Statistics for Engineering and th…
Statistics
ISBN:
9781305251809
Author:
Jay L. Devore
Publisher:
Cengage Learning
Statistics for The Behavioral Sciences (MindTap C…
Statistics
ISBN:
9781305504912
Author:
Frederick J Gravetter, Larry B. Wallnau
Publisher:
Cengage Learning

Elementary Statistics: Picturing the World (7th E…
Statistics
ISBN:
9780134683416
Author:
Ron Larson, Betsy Farber
Publisher:
PEARSON

The Basic Practice of Statistics
Statistics
ISBN:
9781319042578
Author:
David S. Moore, William I. Notz, Michael A. Fligner
Publisher:
W. H. Freeman

Introduction to the Practice of Statistics
Statistics
ISBN:
9781319013387
Author:
David S. Moore, George P. McCabe, Bruce A. Craig
Publisher:
W. H. Freeman